UNIFINplatform

Solution

Unifin Market Surveillance

Supervision stands on evidence, not on suspicion.
The suite turns the event stream into warnings, warnings into cases, cases into measures.
The exchange configures rules, thresholds and reports itself, and every decision rests on evidence.

  • Signals before harm
  • Own database
  • Launch by config
All solutions

Live screens from the product terminals

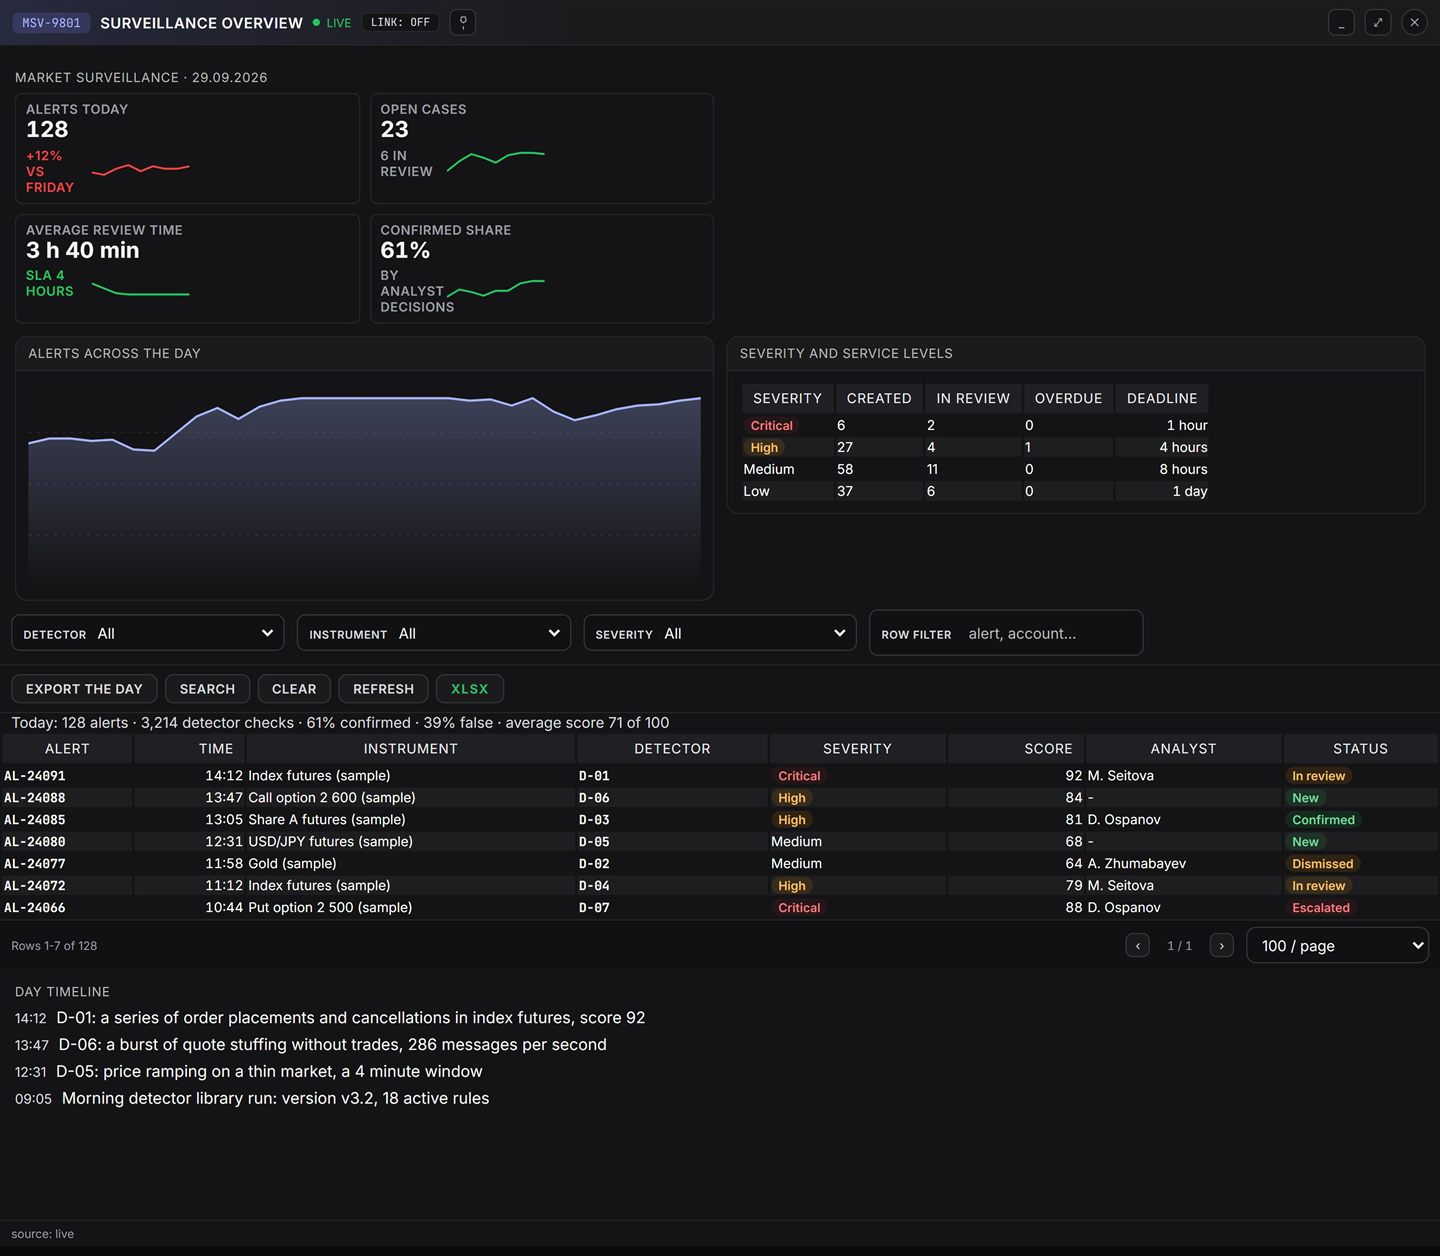
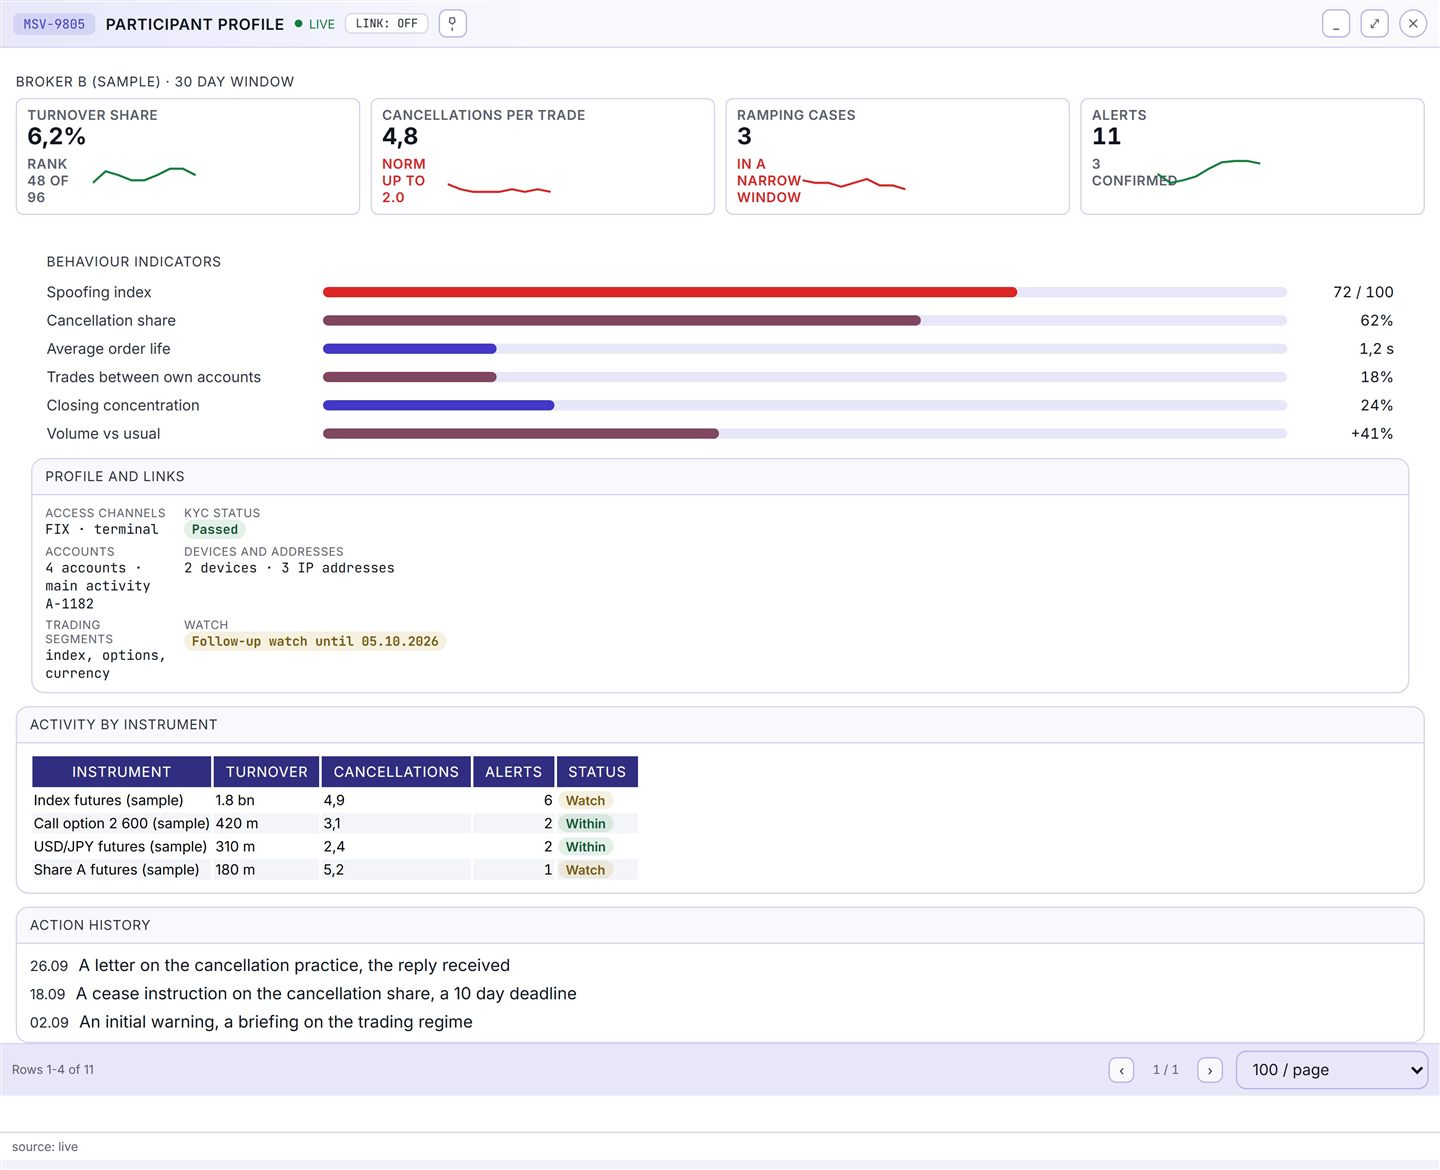
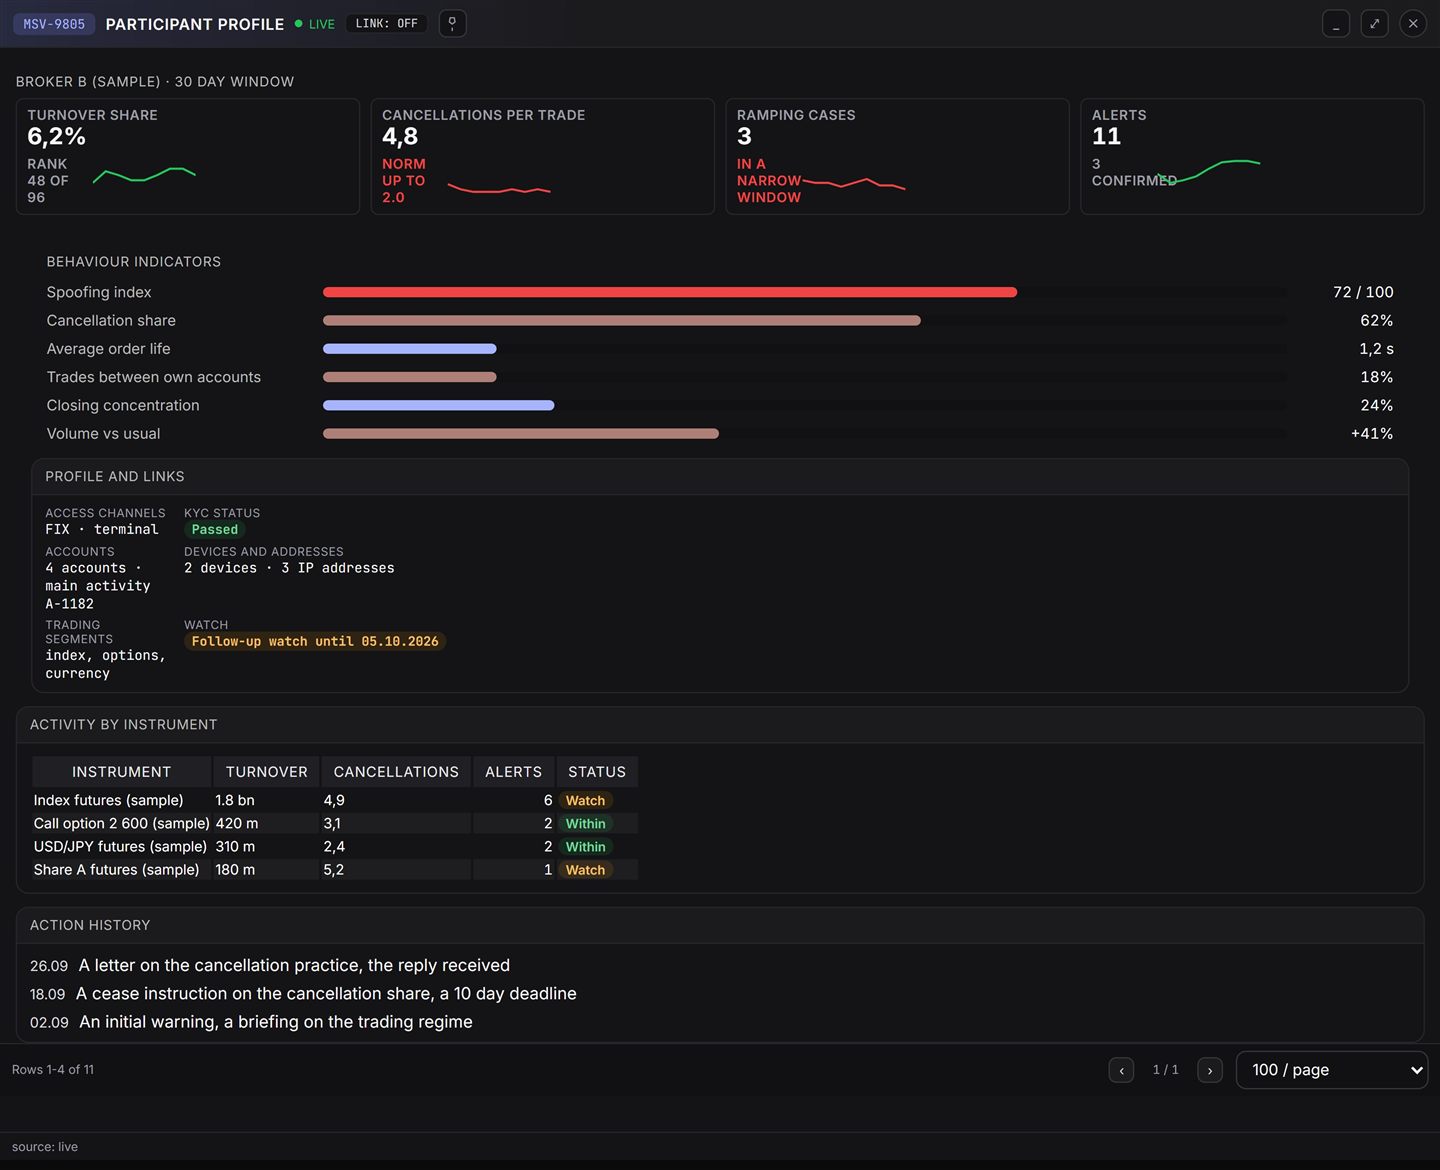
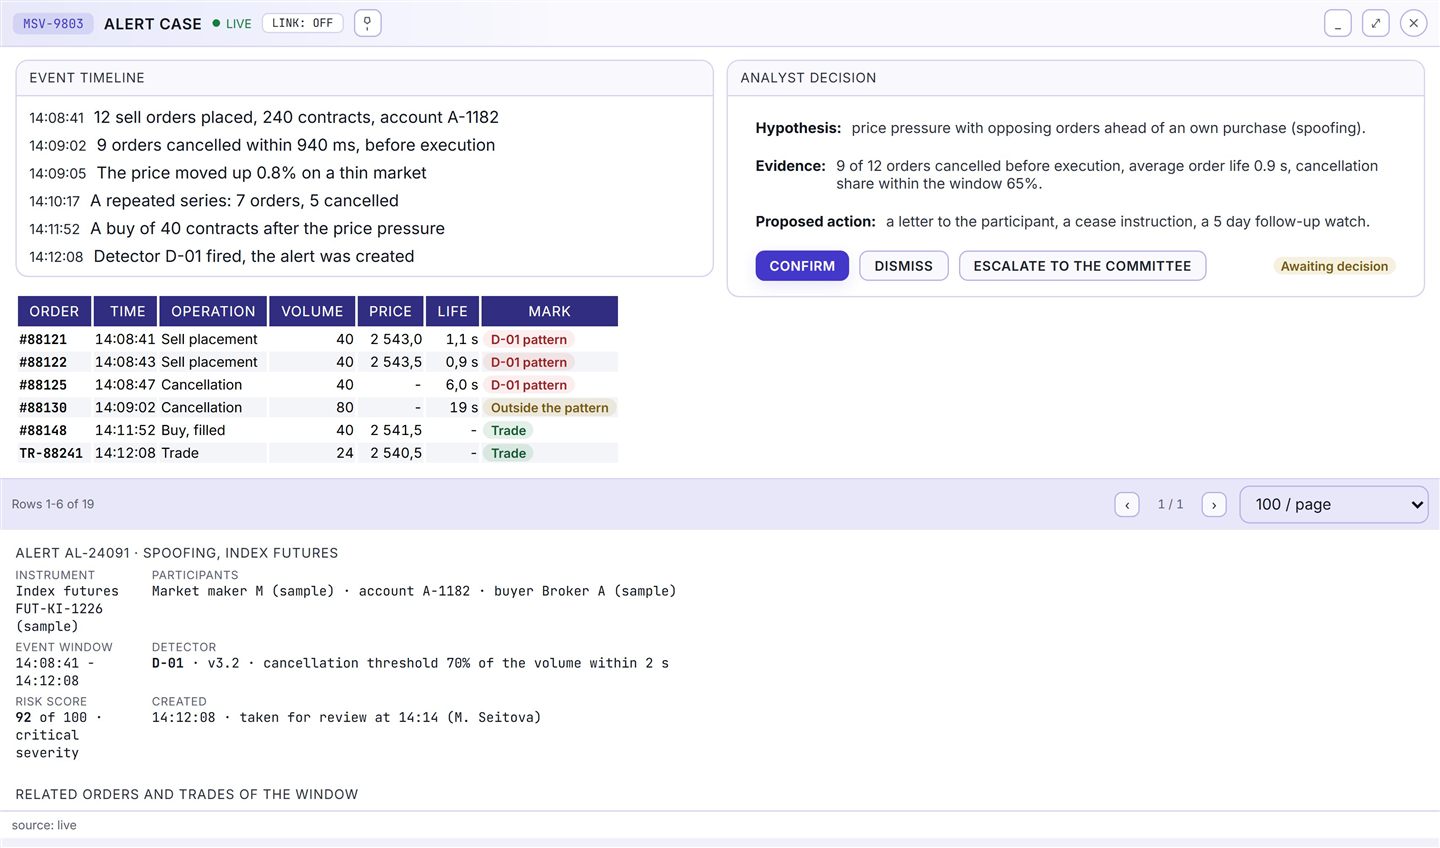
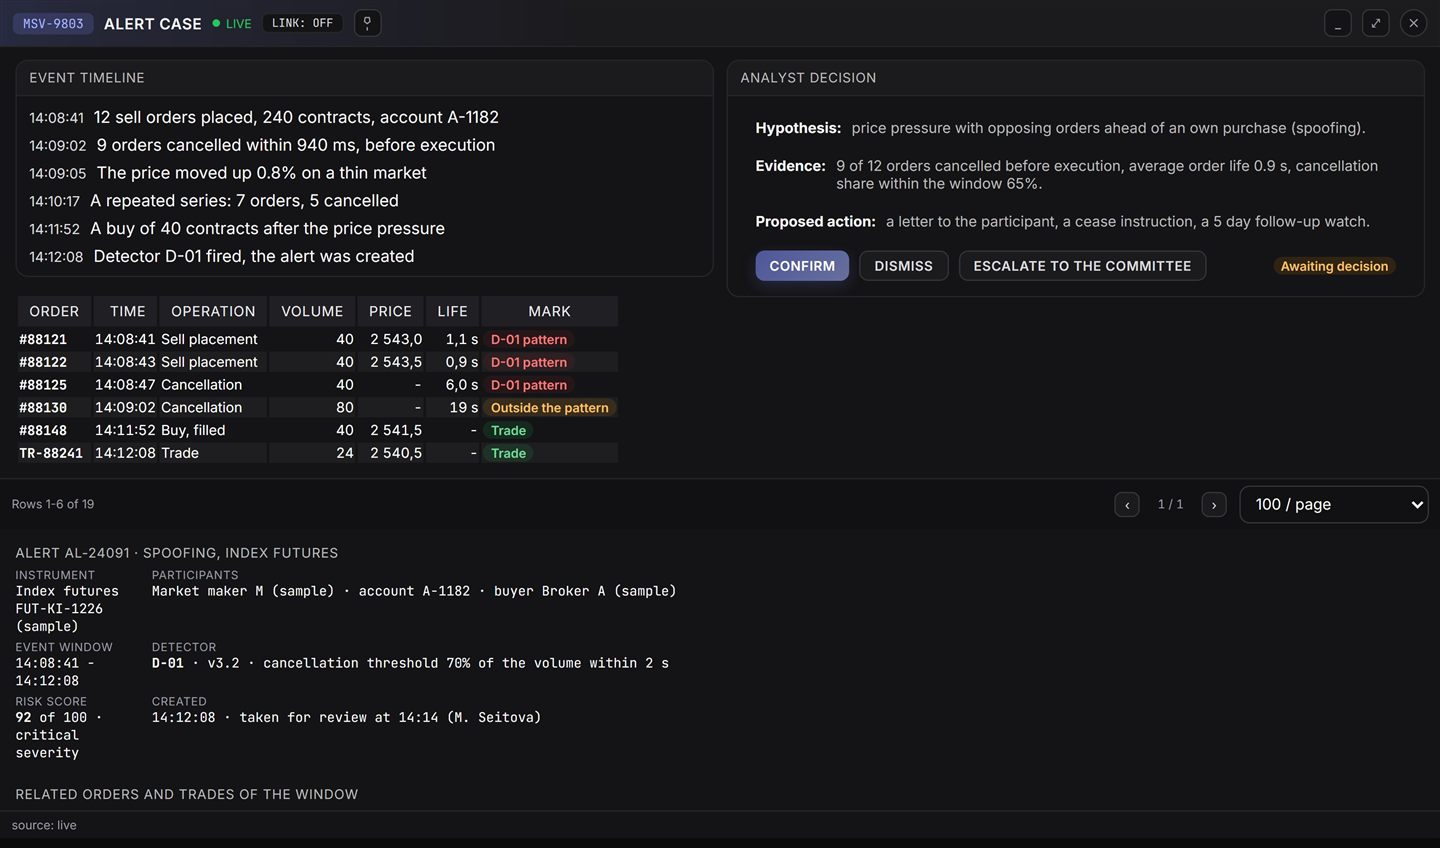
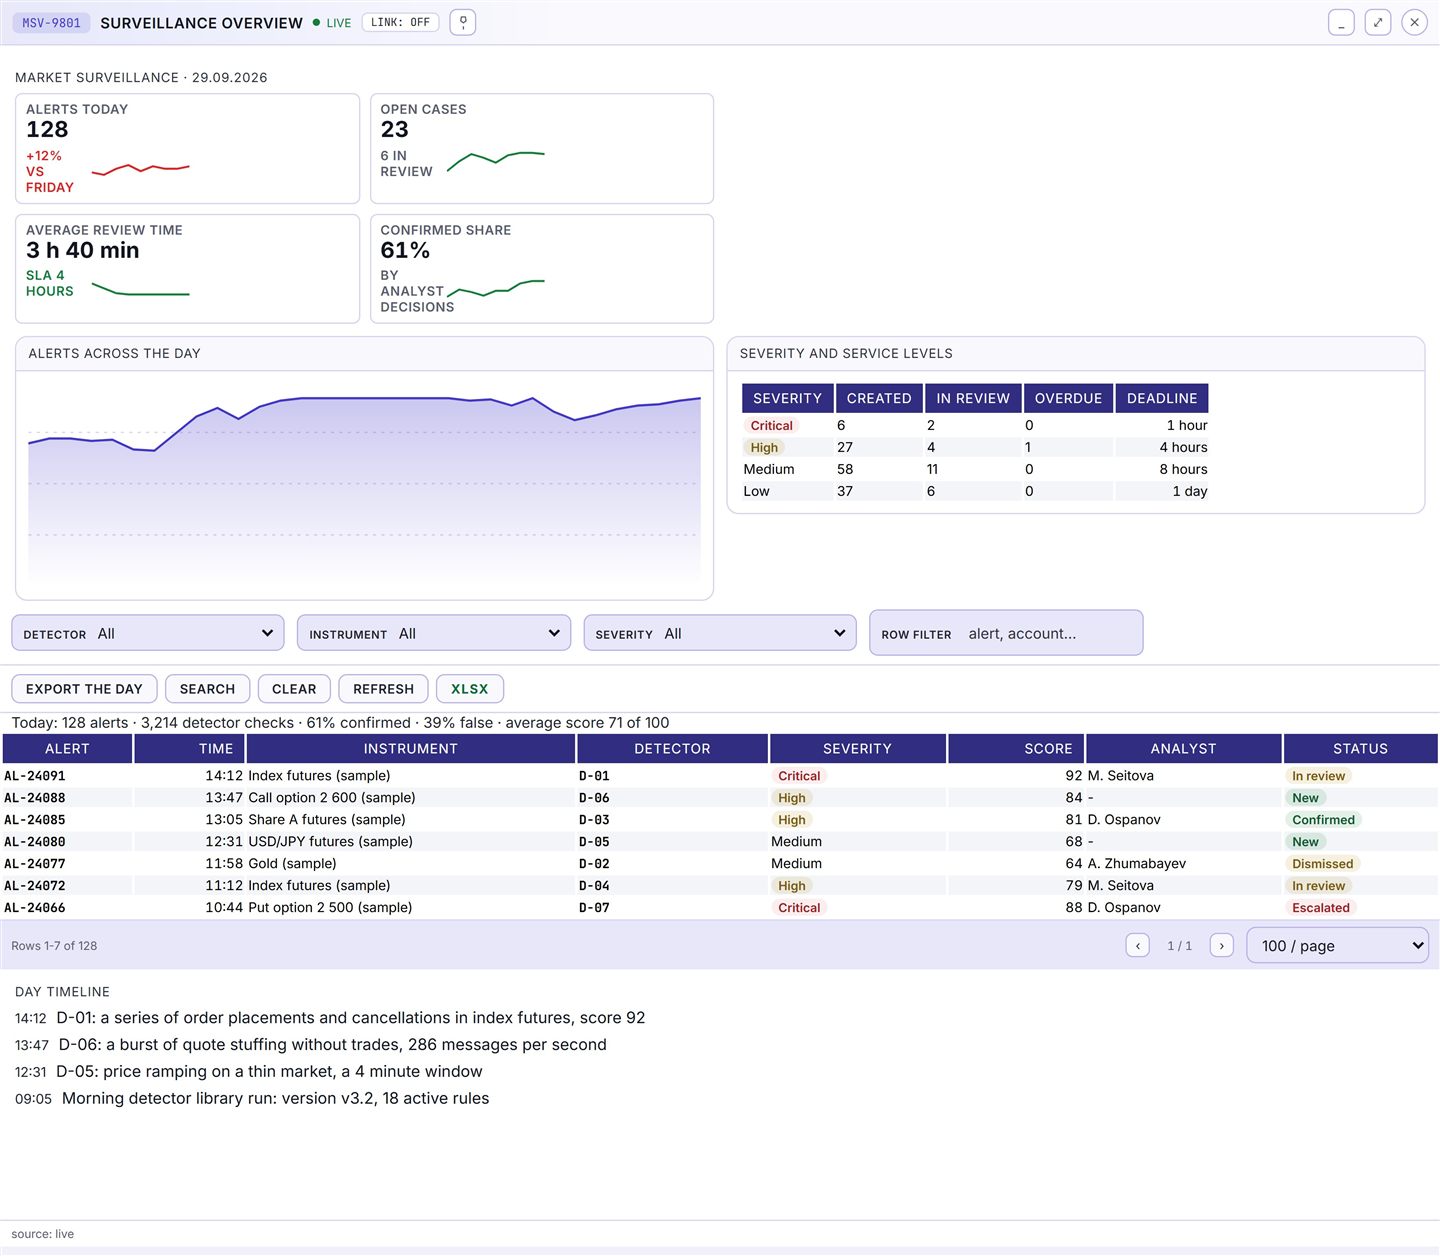
Supervision overview screen with the alert queue Supervision overview screen with the alert queue Participant profile screen with repeat control marks Participant profile screen with repeat control marks Alert card with the order lifecycle window
Demo Unifin Market Surveillance Theme Open separately
Surveillance overview

This is an interface demonstration: the real solution will differ in colours and content for a specific project.

Functions at a glance

Business functions at a glance

From the detection pipeline to regulator exchange.

Detection pipeline
Collects events and builds episode windows
The signal arrives before the harm
Detectors with calibration
Checks the stream with eighteen versioned rules
A threshold changes as a version, not an edit
Queue and investigation
Runs alerts by levels and deadlines
No investigation is lost at shift change
Evidence packs
Keeps the window, the book snapshot and lines
A dispute rests on data, not memory
Account links
Builds clusters of related accounts and marks
Repeat control shows on the profile
Decisions and measures
Closes cases with decisions and measures
Every action has a recorded basis
Regulator exchange
Runs forms, queries and distribution with receipts
The regulator receives reports on time

What runs today

Stream to measures, already running

Stream to measures: the live supervision chain.

Detection

The pipeline turns the event stream into signals.

Cases

Alerts become cases with owners and deadlines.

Links

Account links and participant views support the case.

Journal

The supervision journal keeps the evidence.

Exchange

Reports go to the exchange and the regulator.

Roadmap

New scenario packs are next.

Solution description

Capabilities and overview

Key features

  • Detection pipeline: venue events into episode windows
  • Detectors with versioned rules and threshold calibration
  • Alert queue by levels, deadlines and owners
  • Evidence packs: the window, the book snapshot and the lines
  • Account links: clusters and marks of related participants
  • Cases with decisions, measures and the full history
  • Regulator exchange: forms, queries and distribution with receipts
  • The detector library is configured by the venue itself
  • Supervision journal for every action and decision
  • Reports and extracts from a single data source
  • Roles of the supervision team: analyst, head, regulator
  • Runs on venue data, without external databases
  • Deployment: standalone or as part of the UniFin platform

Product overview

Unifin Market Surveillance is the UniFin platform supervision suite for venues and regulators that need evidence-based signals over market events.

The suite turns the trading core event stream into warnings, warnings into cases, and cases into measures and reporting.

The detector library checks the stream with versioned rules, and threshold calibration stays with the venue.

Every suspicion carries its evidence: the episode window, the order book snapshot and the lines that produced the signal.

The solution runs standalone or as part of the UniFin platform and is configured without changes to the core of trading systems.

What it delivers

What the solution delivers

Detection pipeline

Venue events are usually unpacked in daily exports, and an episode is found after the harm. The solution collects the event stream and builds episode windows in real time. With the solution suspicious episodes are visible before they become losses. In setup the window composition and the stream latency are visible, and the sources come as reference data.

Detectors with calibration

Rules are usually hard-coded in reports, and a threshold change waits for a release. The solution keeps a detector library with versions and measures every one on history. With the solution sensitivity is tuned through calibration runs without touching the core. In setup the precision, recall and false positives of a version are visible, and the thresholds are set in configuration.

Queue and investigation

The alert queue usually lives in a spreadsheet, and context is lost at shift change. The solution runs the queue by level, deadline and the chronicle of the shift. With the solution the critical items are seen first, and not everything is investigated. In setup the investigation steps and decisions are visible for every alert, and the deadlines are configured per segment.

Evidence packs

Evidence is usually reassembled before a review, and some facts are gone by then. The solution keeps the window, the order book snapshot and the evidence lines together with the alert. With the solution a dispute is resolved on data, not on the memory of participants. In setup the evidence is visible line by line, and the pack composition comes as reference data.

Account links

Related accounts are usually found by hand through indirect signs. The solution builds clusters of related accounts and repeat-control marks. With the solution the links between participants are visible, and repeat breaches are not missed. In setup the cluster composition and the mark history are visible, and the linking rules come from the setup.

Decisions and measures

Decisions are usually recorded in text files, and the basis is hard to reconstruct. The solution closes episodes with recorded decisions and runs measures: letters, orders, handover. With the solution actions follow the rulebook, and every step has a trail. In setup decisions and measures per case are visible, and the templates are part of the configuration.

Regulator exchange

Forms are usually assembled by hand for every date, and receipts get lost. The solution runs the forms catalog with deadlines, ad hoc queries and distribution. With the solution the regulator gets an answer on time, and delivery is proved. In setup the run history and resends are visible, and the schedule comes as reference data.

Coverage

What it covers

Venue regulation: deadlines, forms and channels are configured for the market rules.

Detection pipeline

Event collection, window building, the detector library, scoring and the alert queue.

Alerts and cases

Alert cards, investigation steps, decisions and measures: letters, orders, regulator handover.

Account links

Clusters of related accounts and repeat-control marks on the participant profile.

Instruments and participants

Anomaly windows per instrument and the participant profile with the full history.

Reports and exchange

Forms catalog, deadlines, scheduled submissions and persisted receipts.

Supervision journal

An immutable log of what the detector saw and what the analyst decided.

Calibration

Threshold against history: precision, recall and false positives decide the next rule version.

Stand

Screens of the solution

Overview, alert card, participant profile and the regulator exchange.

Supervision overview screen with the alert queue
Supervision overview: the alert queue, levels and investigation deadlines
Alert card with the order lifecycle window
Alert card: the episode window, orders and cancellations as evidence
Participant profile screen with repeat control marks
Participant profile and repeat control
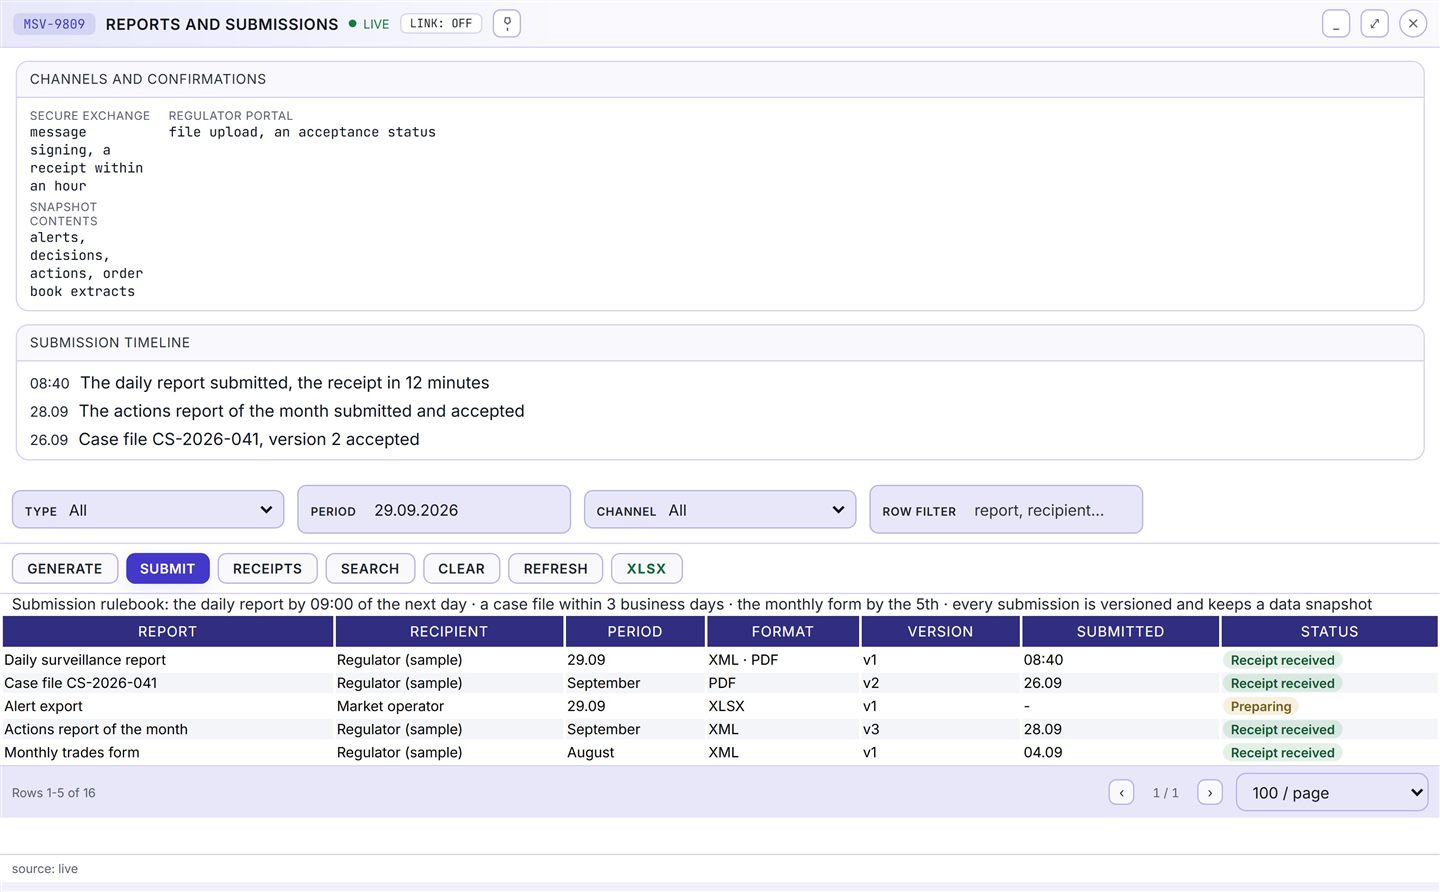
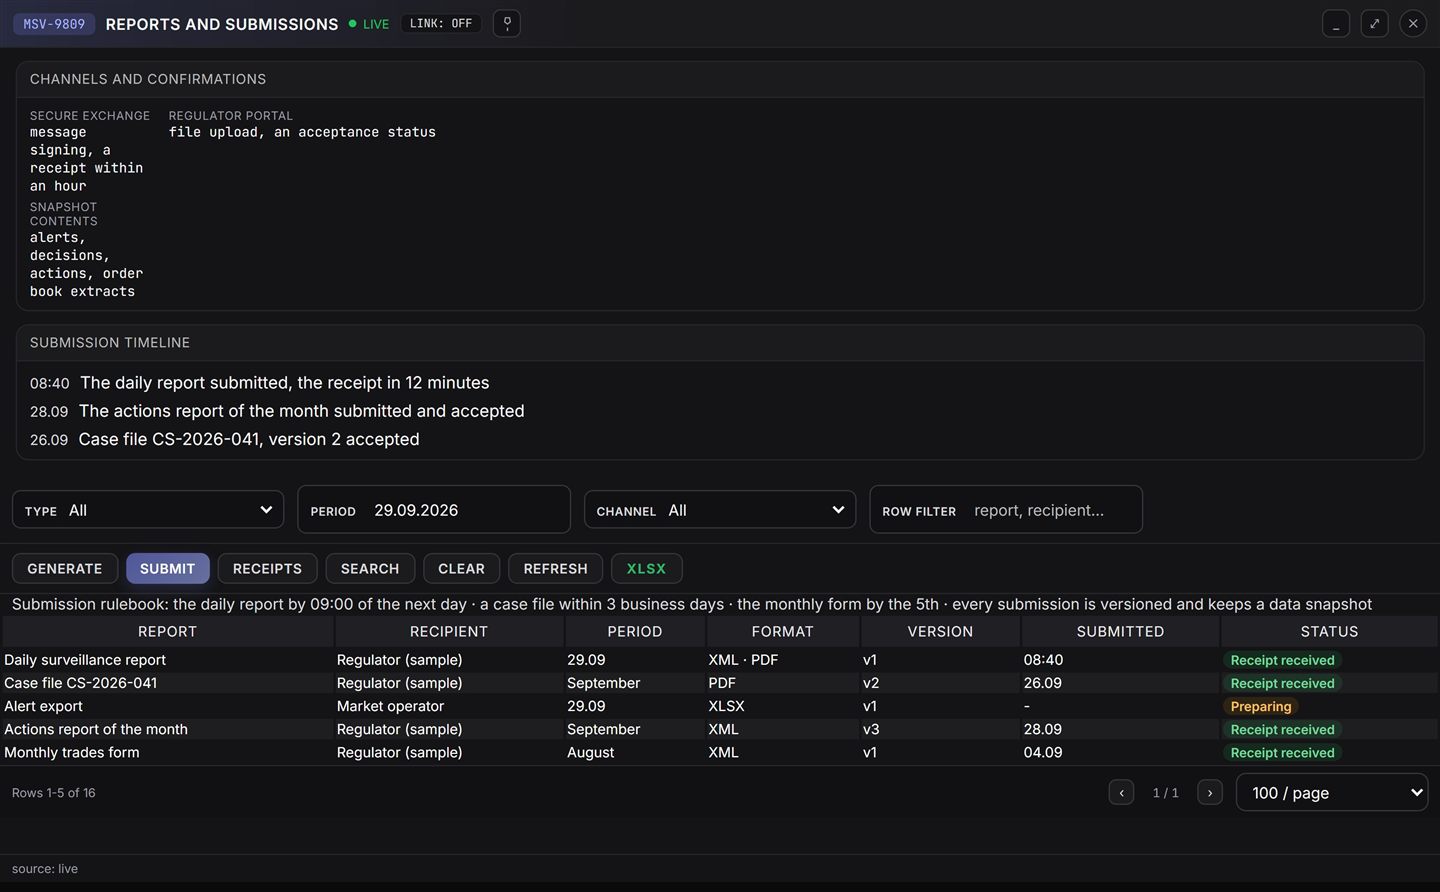
Reports screen with the forms catalog
Reports and regulator exchange: forms catalog and submissions

How it works

From an event to a measure in five steps

The path of an episode: stream, detector, alert, investigation, decision, report.

  1. 1

    The event stream arrives

    Orders and trades come from the core; the gateway stores windows.

  2. 2

    Detectors run

    The library turns suspicious episodes into scored alerts with a deadline.

  3. 3

    The analyst investigates

    The shift opens the alert card: window, snapshot and evidence lines.

  4. 4

    The decision is recorded

    The episode closes with a recorded decision and account links.

  5. 5

    Measures and reporting

    Letters and the handover go out; forms run by the calendar.

Industries

Industries it serves

The suite works where the market needs supervision with evidence. At the venue, at the regulator and inside the compliance of the participants.

Exchange / venue

Trading, supervision, market data and post-trade on one governed core, launched by configuration.

Broker / investment firm

Client access and risk control on the same rails as the venue: terminals, mobile and pre-trade limits.

Architecture

Architecture and access

The suite is built on the services of the solution and keeps external responsibilities external.

Service suite

Collection gateway, event monitor with order book snapshots, detectors and scoring, account links, cases and the journal.

External states stay external

Checks from the KYC platform, assets from the CSD, money from the bank; states arrive via channels.

Three zones, active-active

Stateless services run in three zones; storages are reserved active-passive. The platform style is event-driven and AI-native.

Shared platform mechanics

Base services: security, configuration, queues. A new detector connects without touching the collection core.

AI layer

The AI layer groups alerts and drafts case summaries; people approve each step, the journal records it.

Architecture scheme The same architecture as a standalone page. Open the diagram separately

Readiness

Ready today, next in line

Delivered as a product; the next wave adds market-specific regulation.

Ready today

  • Detector library with versioned rules and calibration runs
  • Alert queue, case cards and measures with deadlines
  • Evidence packs and account links for investigations
  • Regulator exchange: forms catalog, ad hoc queries and run history

Next in line

  • Connector presets for a specific market regulation
  • Deeper pattern library for derivatives windows
  • Public API for supervision data exchanges (roadmap)

Releases

Release history

Quarterly releases from the foundation of the platform (2020); the supervision suite became a product in 2023.

2025 Q4

  • The detector library runs on the venue's history; scoring and investigation deadlines are introduced.

2026 Q1

  • Case cards and measures: letters, orders and regulator handover with an audit trial.

2026 Q2

  • Reports portal: forms catalog, ad hoc query builder and distribution schedules.

2026 Q3

  • Account links and repeat control profiles on the participant screens.

Detailed description

Detailed description

The module map, the metrics and the delivery frame.

How the suite is assembled

Channels and clients
FIX 4.2 / 4.4 / 5.0, REST with mTLS, SFTP files, web portals
Edge and access
API gateway with 126 routes, Keycloak single sign-on, WAF and CSP
Platform core services
surveillance-ms detector rules case services data quality AI agentic layer Services of the suite on the shared platform core
Data and events
PostgreSQL 17 per service, Redis 7, RabbitMQ 3.13 quorum queues, transactional outbox
Results and reporting
Portals, reports, regulator and partner channels

Technology stack

Runtime and backend: Java 21 (LTS), Spring Boot 3.5.16, Spring Cloud 2025.0.3, Gradle, Flyway 10.15.

Data: PostgreSQL 17 per service, Redis 7 with Sentinel, RabbitMQ 3.13 quorum queues, transactional outbox and DLQ replay.

Portals: Next.js 16.3.3, React 19, TypeScript 5; OpenTelemetry 1.31 to Jaeger.

Delivery: Kubernetes and Helm, Vault secrets, Prometheus and Grafana, Docker Compose for pilots.

Visualisation: Apache Superset 4 and ECharts 5 for dashboards and charts, Grafana for operations panels, Mermaid for documentation schemes and the portal diagrams.

Signals and analytics

  • Manipulation patterns from the venue own data: pump and dump, wash trades, marking the close, layering and spoofing.
  • Observable groups: related accounts by owner, device, address or order pattern.
  • Alert tuning without code changes: thresholds, windows and weights with test runs on history.
  • Every alert carries its evidence: trades, orders, quotes and the exact rule version.

Cases and decisions

  • A case from alert to decision with stages, owners, deadlines and the full communication log.
  • Requests to participants with templates and deadlines; answers attach to the case automatically.
  • Outcomes with reason codes; statistics by pattern, instrument and participant.
  • Regulator packages assemble from the case: evidence, decisions and metadata in one archive.

Operations and integration

  • Data completeness control: the surveillance suite knows when the venue stream has gaps.
  • Roles: analyst, senior analyst, head of surveillance; four-eyes on decisions and publications.
  • Audit journal: who watched what, when and on which basis.
  • Connection to the venue stream and the participant registry as adapters; no changes to the trading core.

Architecture

  • Built from the platform core: surveillance-ms, the detector rules, the case services and the data quality suite.
  • The suite works through platform contracts: one register of record, no shadow copies of the data.
  • Scaling adds nodes, not rewrites: stateful services grow with Patroni, RabbitMQ and Redis clusters.

Integrations and access

  • OpenAPI for every service: 978 documented endpoints behind 126 gateway routes, plus webhooks and SFTP where partners need files.
  • Single sign-on: Keycloak 26.1, OIDC and JWT, roles, MFA and API keys with quotas.
  • Evidence by default: the audit journal, idempotency keys on writes and a record for every disclosure.
Detailed description

Leave your contacts to open the detailed description and download the PDF with architecture, cases and delivery details.

See the supervision suite on your data

Bring an episode from your history: we will run it through the detectors and show the evidence pack end to end.