UNIFINplatform

Solution

Unifin Charts

A charting library for exchanges, brokers and banks.
Chart types, indicators, drawing, volume profile and trading from the chart.
Runs together with platform services: data, alerts, orders.

  • All asset classes
  • Drawing tools
  • Indicator library
All solutions

Interactive

The chart gallery

Scenes, zoom, replay and levels: pan the chart like a terminal.

  • Wheel to zoom, drag to pan
  • Crosshair with per-bar data
  • Replay, live tape, Fib

Drag the chart to pan, scroll to zoom.

Live tape

Synthetic data: an interface and a stage, not market advice.

Functions at a glance

Business functions at a glance

From data to a trade.

Chart workspace
Holds types, timeframes and layouts in one place
Analysis runs in one window
Drawing and markup
Tools anchored to candles with an edit history
Team markup is reused
Indicators and comparison
Computes overlays on long series
Signals and comparison at hand
Volume profile and clusters
Shows the POC, the value area and bid and ask delta
Where volume holds becomes visible
Alerts and events
Fires from a tick; delivery by the platform: push, e-mail and SMS
Faster than manual watching
Trading from the chart
Takes limit, market, stop-limit and IOC, runs the stop
A trade without switching
SDK
Embeds the chart in a portal in a few lines
The portal runs under your brand

What runs today

The chart stack, already running

Draw, compute, trade: the live stack.

Render core

The render core draws every chart type.

Indicators

The indicator engine computes the library.

Drawing

Drawing tools and profiles are in the kit.

Alerts

Alerts and events run on the chart.

Trading

The trading layer sends orders from the chart.

Roadmap

More data adapters are next.

Solution description

Capabilities and overview

Key features

  • Timeframes from minutes to weeks across all asset classes
  • Drawing tools anchored to candles with an edit history
  • Indicator library: overlays and oscillators
  • Volume profile: POC, value area and deltas
  • Comparison of instrument series on one screen
  • Alerts from a tick: push, e-mail and SMS by the platform
  • Trading from the chart: limit, market, stop-limit, IOC
  • Layouts of several panels on one desk
  • Position management and stop orders from the chart
  • SDK for embedding the chart in a portal
  • Journal of annotations and workspace settings
  • Runs together with platform data services
  • Fine view control: a left price axis, a volume pane and per-field legend

Product overview

Unifin Charts is the UniFin platform own charting library for exchanges, brokers and banks.

The library holds chart types and timeframes, drawing, indicators, the volume profile and trading from the chart.

The workspace assembles from panels, while data and events come from platform services.

Alerts fire from a tick, delivery runs by the platform, and trades leave to the trading suite.

The library embeds into portals through the SDK and runs together with the UniFin platform.

What it delivers

What the solution delivers

Chart workspace

Layouts usually spread across windows: the chart, the markup and a comparison in different tabs. The solution keeps chart types, timeframes and layouts in one place. With the solution ideas are found faster and switching between tools stops. In setup, layouts are saved and reference data sets data types without code changes.

Drawing and markup

Markup is lost when a window refreshes, and the work starts over. The solution anchors tools to candles and keeps the history and team templates. With the solution markup is reused instead of rebuilt. In setup, the toolset and link sharing are configured.

Indicators and comparison

On a short window signals lag, and on the full history the chart slows down. The solution computes overlays on long series and holds the speed. With the solution series are compared without delays. In setup, indicator sets and parameters come from the library without code changes.

Volume profile and clusters

Volume is usually judged by eye from bars. The solution shows the POC, the value area and bid and ask delta by cluster. With the solution trades are built on the fact, not on a guess. In setup, the breakdown by price is available, including imbalances.

Alerts and events

The market is watched by hand, and the signal comes after the move. The solution fires from a tick in the terminal, delivery is taken by platform services: push, e-mail and SMS with a snapshot. With the solution the reaction is faster than manual watching. In setup, conditions, channels and the schedule are configured.

Trading from the chart

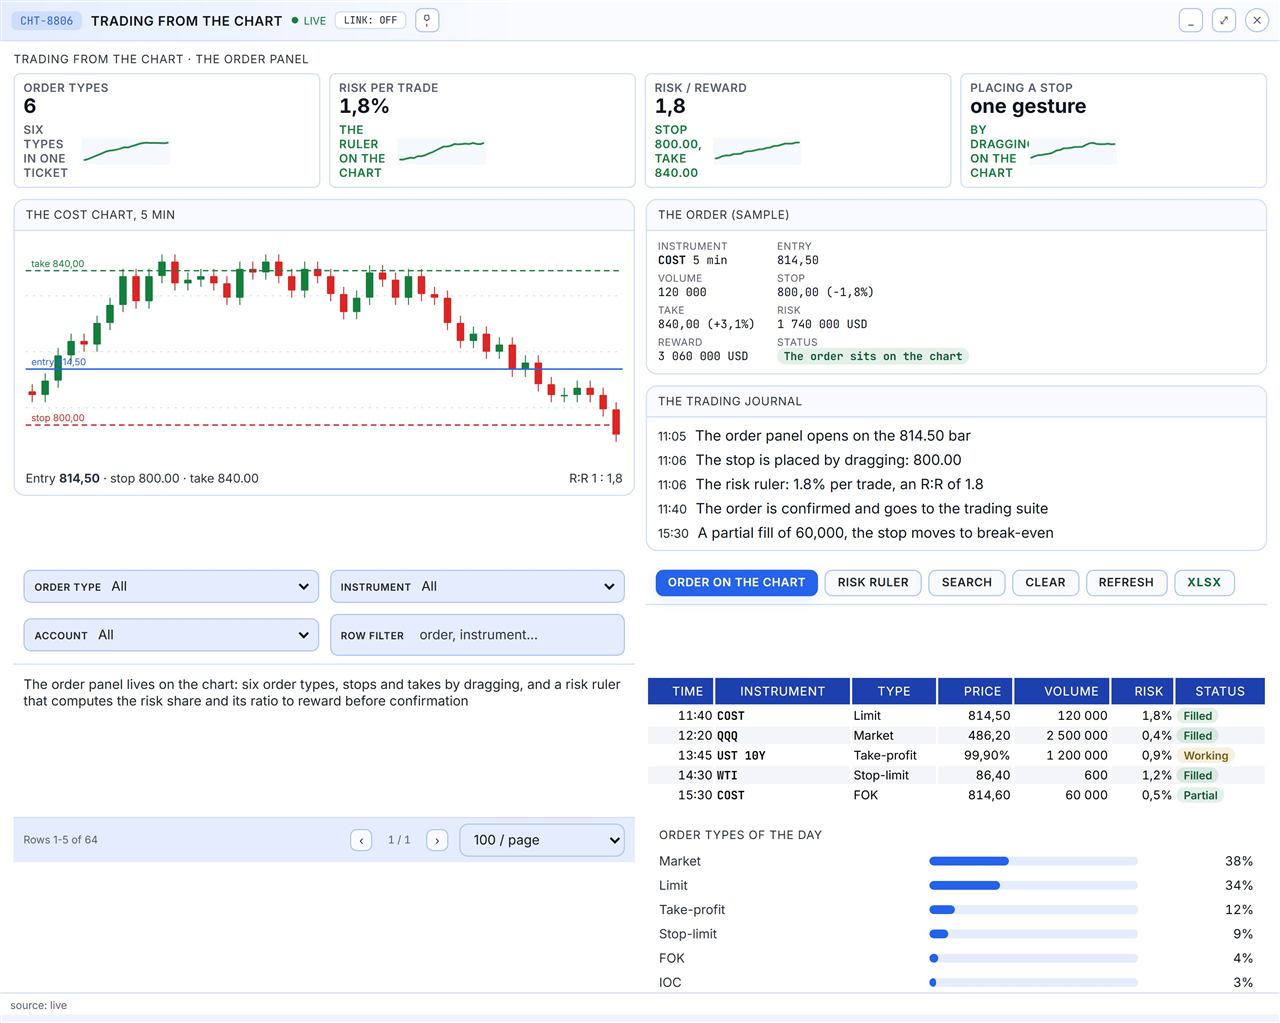
An idea and an order live in different windows, and stops are recalculated by hand. The solution takes limit, market, stop-limit and IOC orders from the chart, with the stop moved by dragging. With the solution a trade runs without switching. In setup, the trade journal, order types and risk rules are available.

SDK

An in-house chart takes months, and every change drags a portal release. The solution embeds in a few lines with SDK methods and events. With the solution the product reaches the market sooner. In setup, one codebase remains without rewriting the integration.

Coverage

The library set

One route: data, render, analysis and a trade.

The render core

WebGL and Canvas 2D, a 60 FPS target.

Data and timeframes

Ticks and bars, timeframes from minutes.

The indicator engine

Overlays and oscillators on long series.

The drawing engine

Tools by category, candle anchoring.

Profiles and clusters

The POC, the value area and delta.

Alerts and events

Price conditions, push, e-mail and SMS.

The trading layer

Limit, market, stop-limit, IOC; orders to the trading suite.

The SDK and the journal

Methods and events (plan); the platform journal.

Business value

Charts that pay back in the trading day

A ready charting library for financial systems: ship a professional terminal without building charts from scratch.

Faster time to market

A broker or an exchange embeds a full chart terminal in weeks, not quarters.

One library, every screen

Dashboards, portals and mobile reuse the same engine, data layer and themes.

Lower cost to build and run

No in-house charting team to hire and keep; updates arrive as versions.

Clean provenance

Own code with permissive dependencies only, documented for audit and licensing.

Own branding

Themes and layout follow the customer brand on every surface.

Documented

The library ships with a public documentation site at charts.unifinai.com.

  • release 26.4.9
  • Pro line 26.6.0
  • 26.10.1 to 26.10.4
  • 14 chart types
  • over 100 indicators

The library

Unifin Charts in detail

Unifin Charts is the UniFin platform own charting library: render, data, indicators, drawing, profiles, alerts and trading in one package.

Editions: Standard and Pro are the shipped packages. Interactive is the live terminal on the stand, where the chart streams and reacts.

The full documentation and API reference live on the dedicated site charts.unifinai.com: galleries, guides and every version.

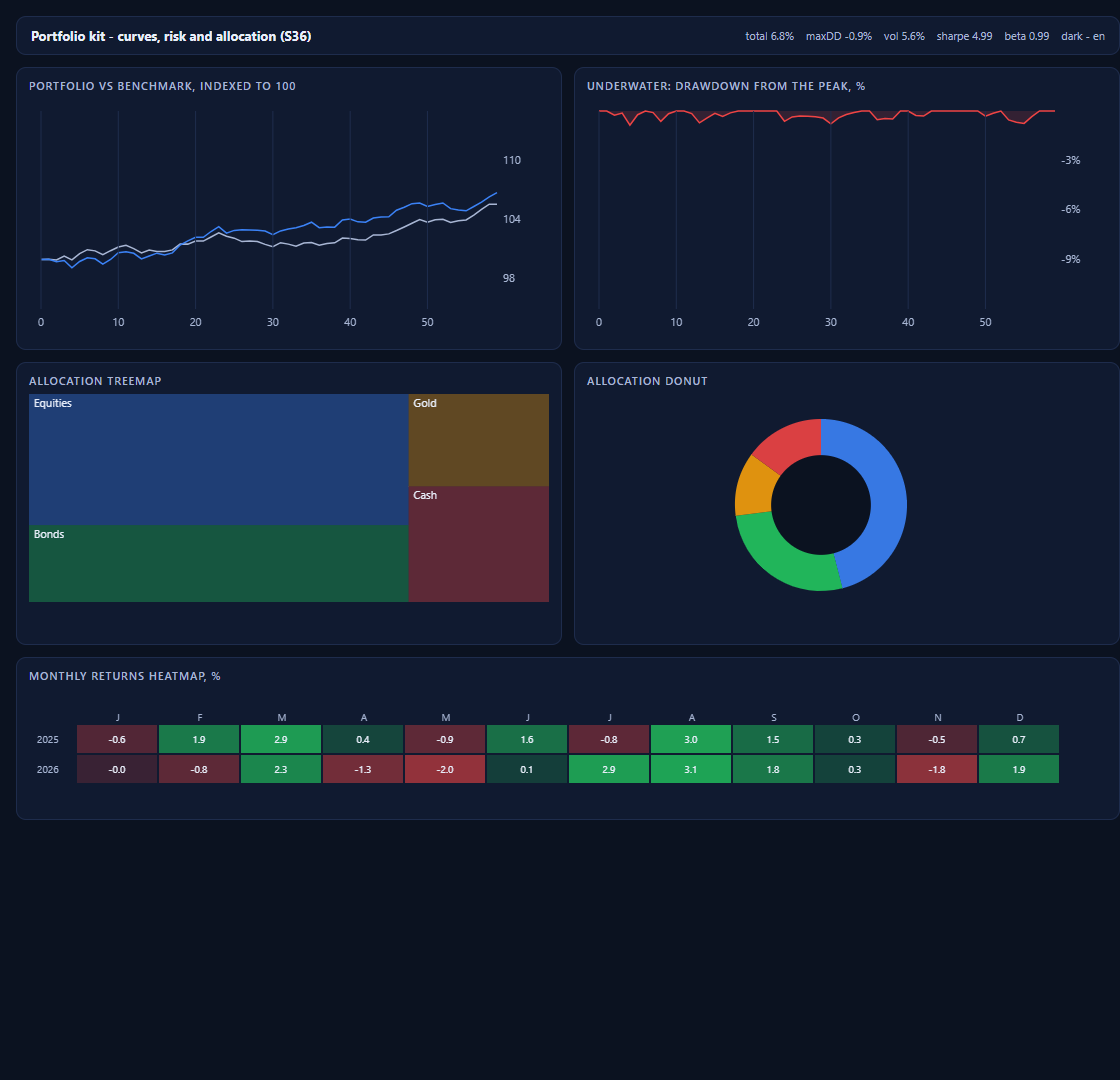
Portfolio kit: curves, allocation and the monthly heatmap
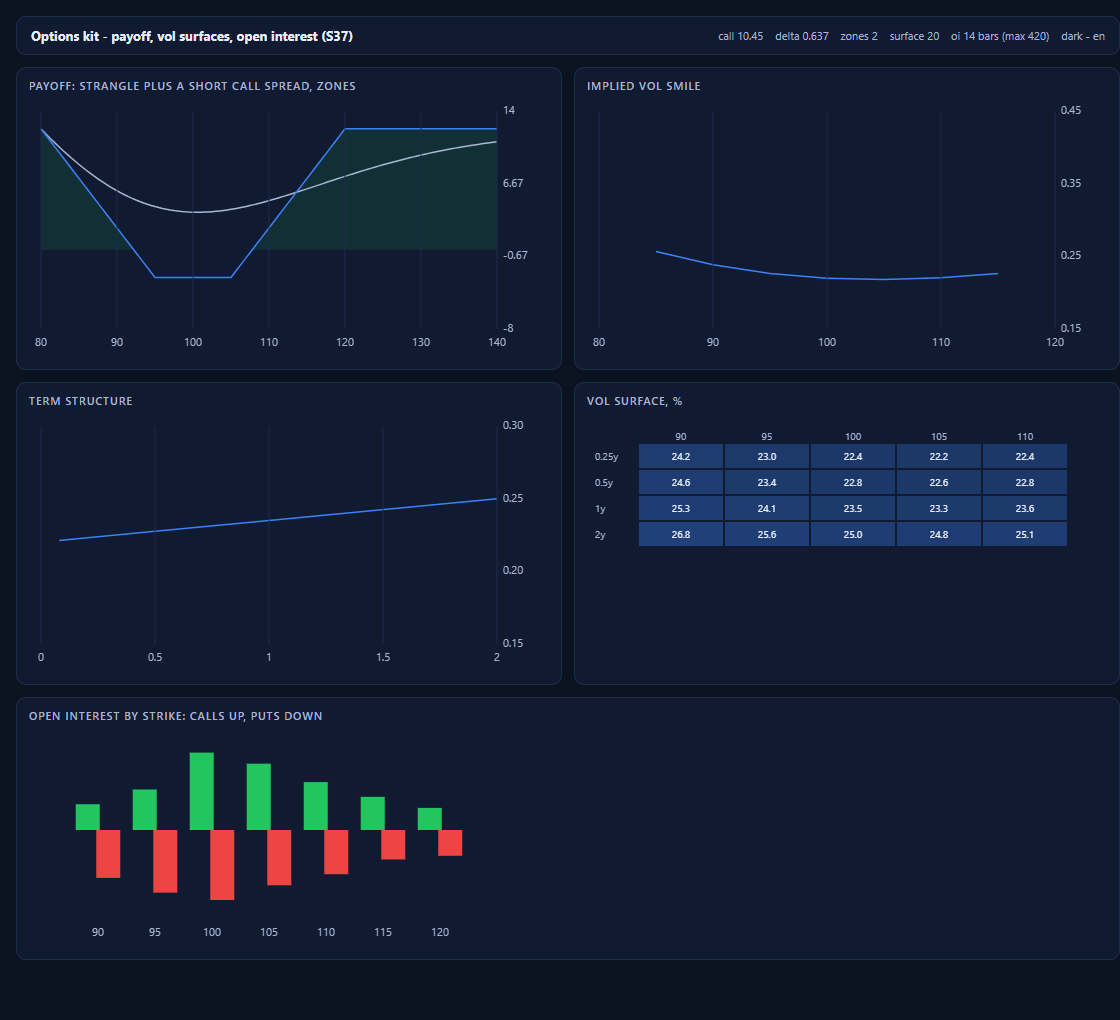
Options: the chain, the greeks and the expiry ladder
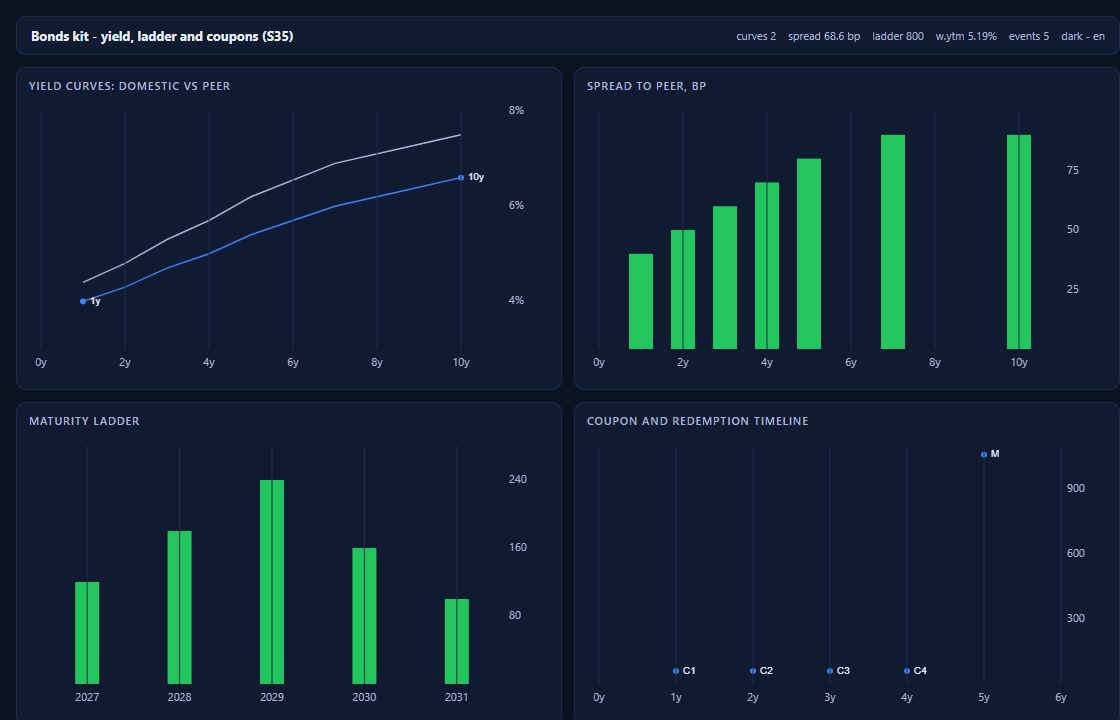
Yield curves: domestic against the peer spread
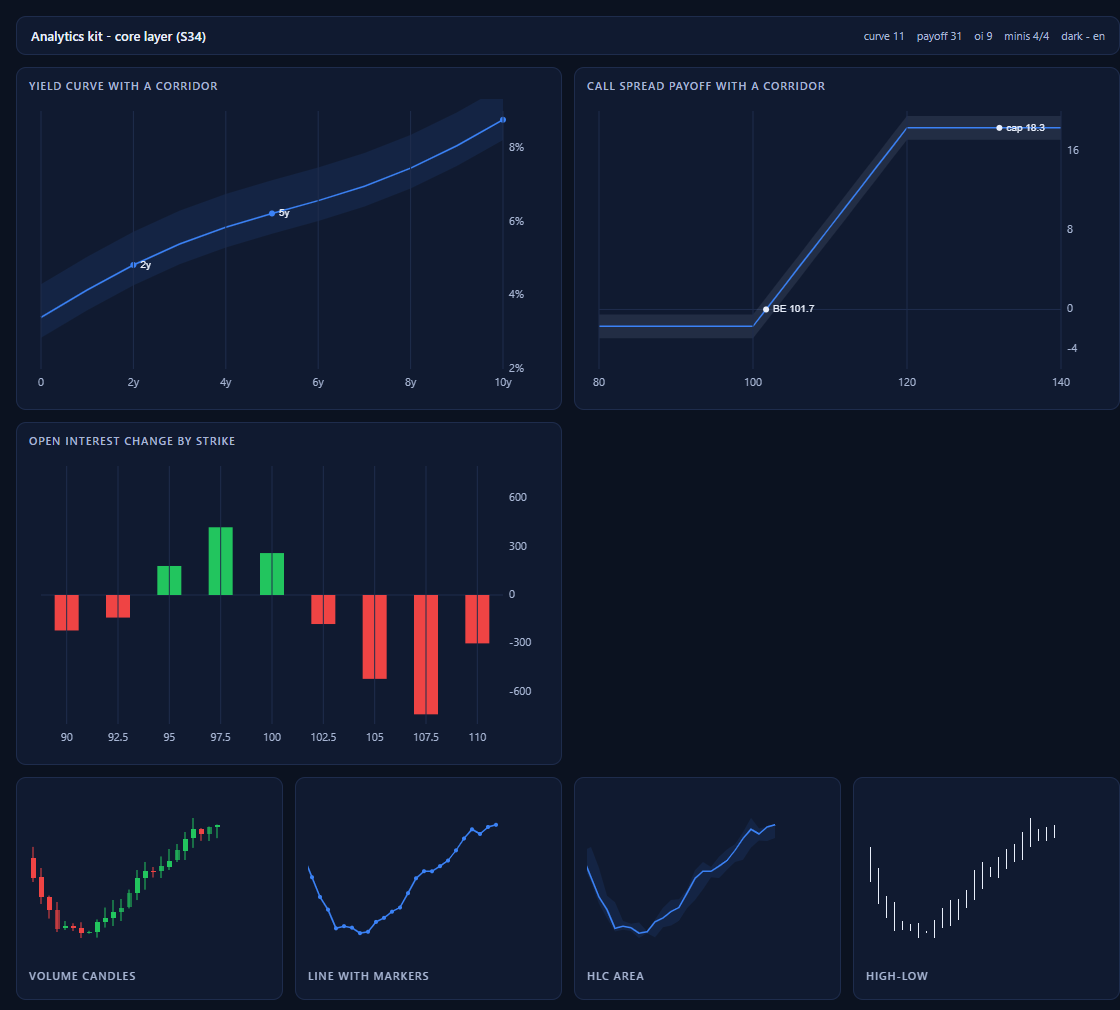
Analytics: returns, drawdown and the risk panel
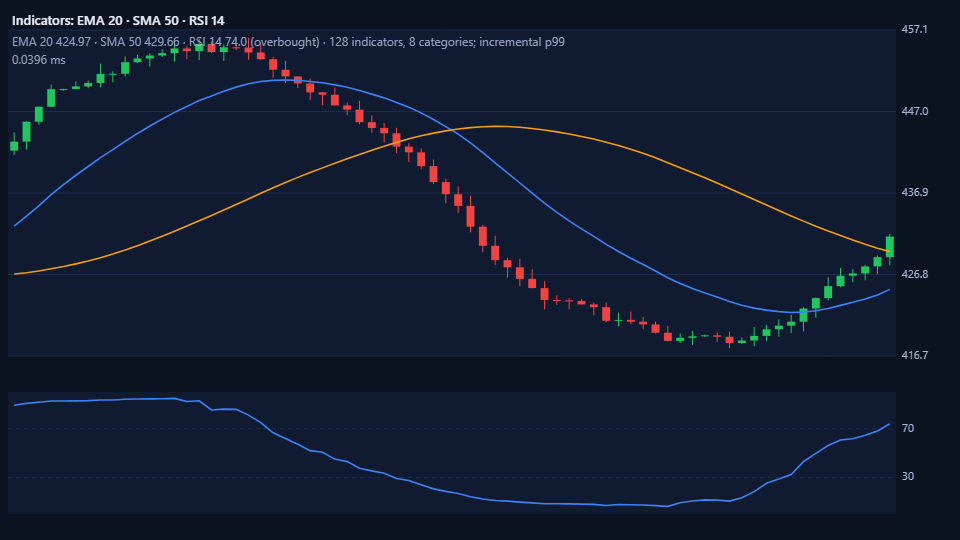
Indicators: overlays and oscillators on one series
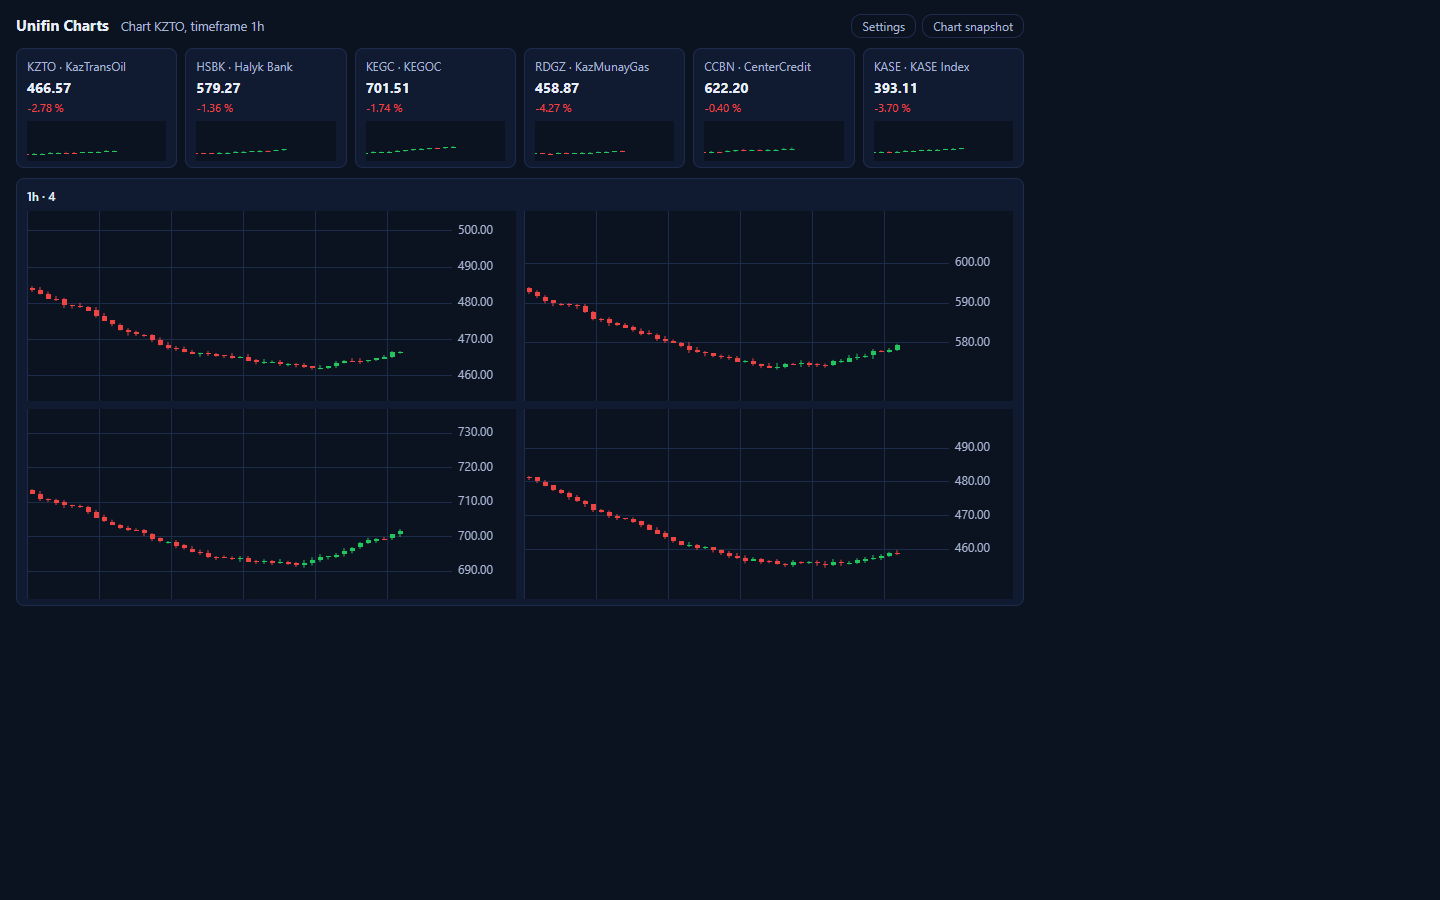
Dashboard of mini charts from the same library
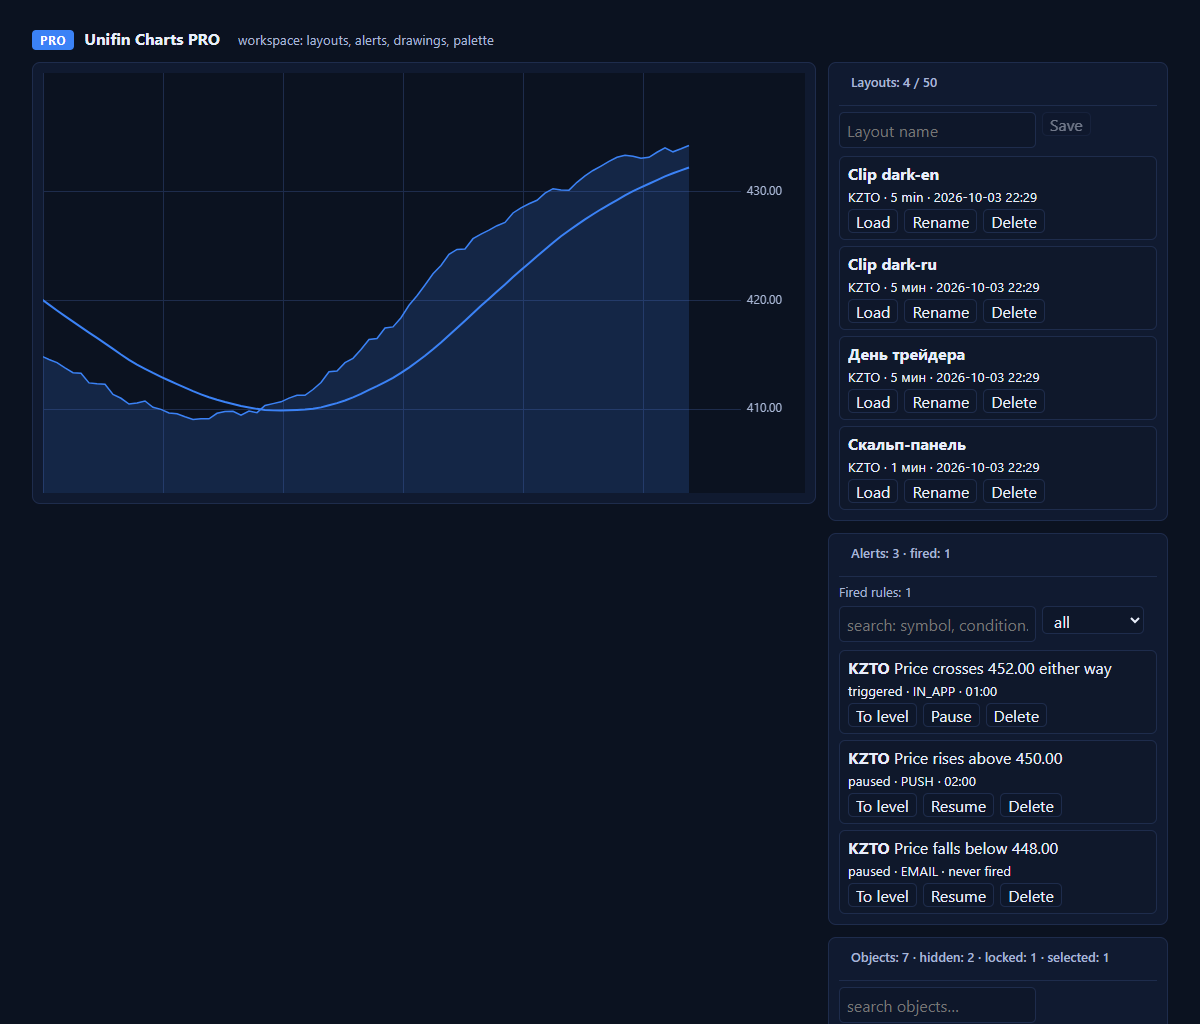
The Pro workspace: tools, layouts and the replay
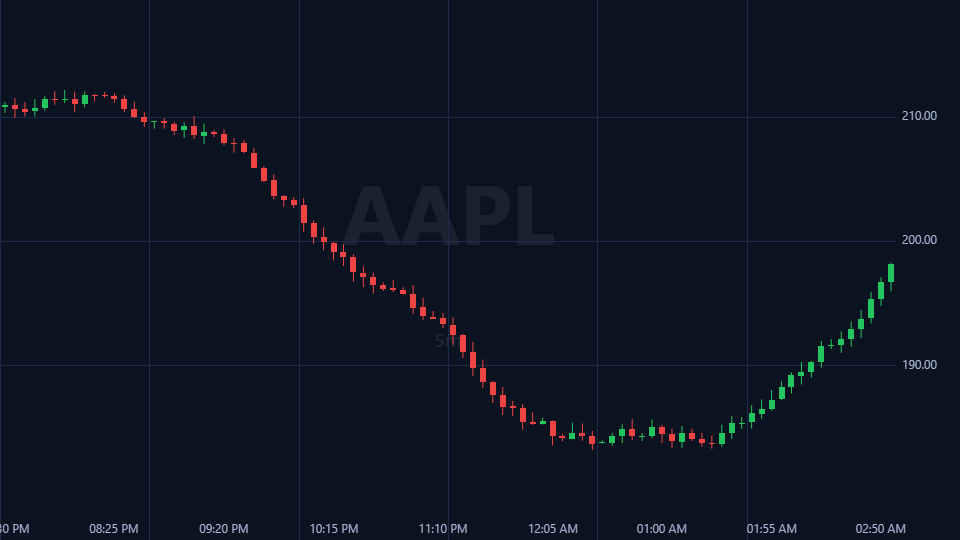
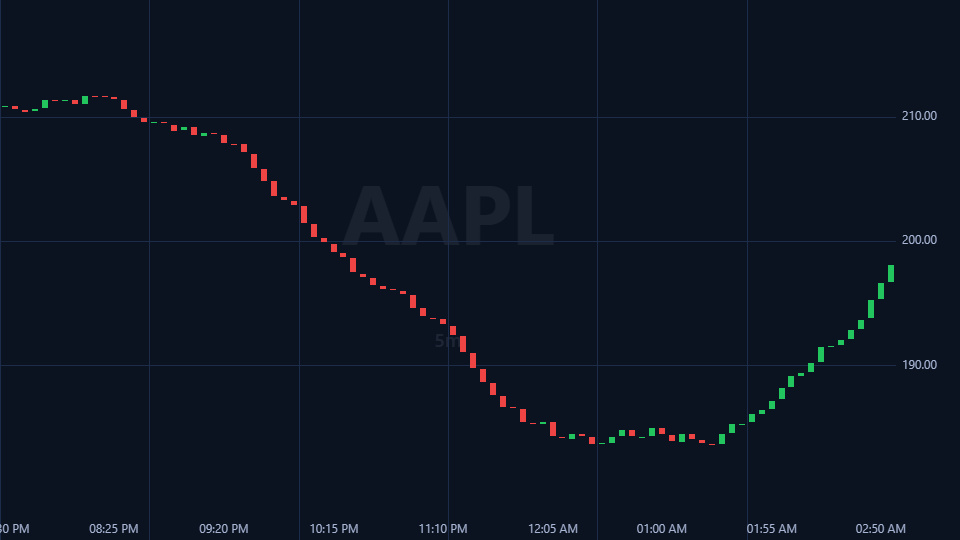
Candlestick chart
Candlestick chart
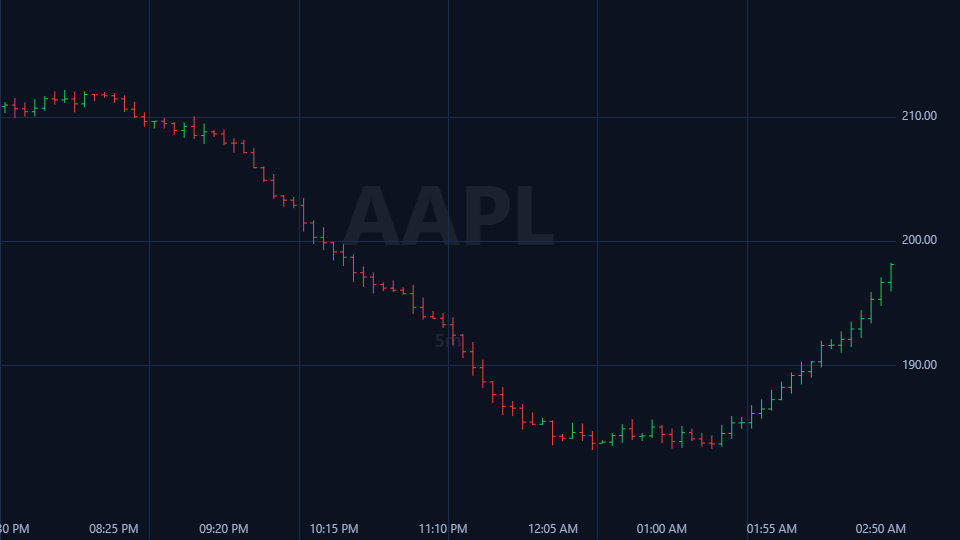
OHLC bars
OHLC bars
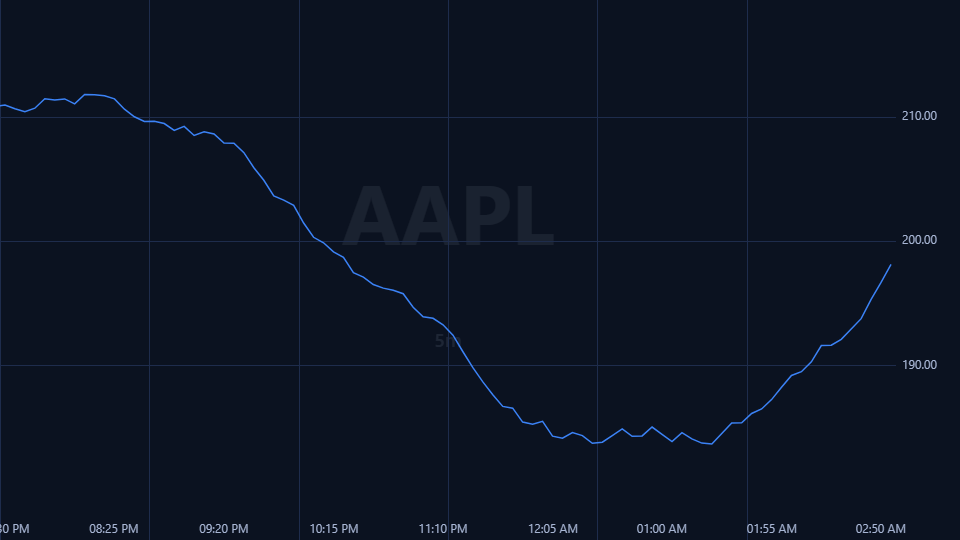
Line chart
Line chart
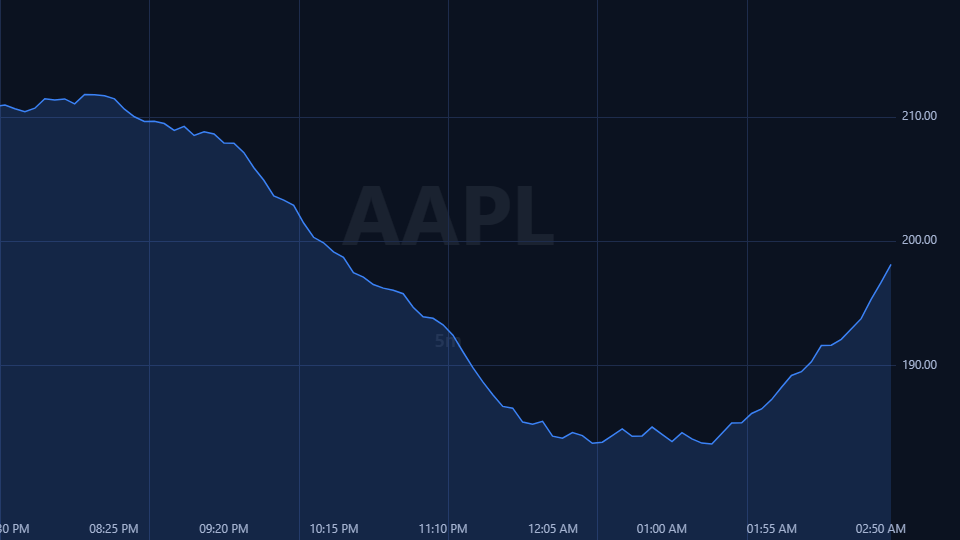
Area chart
Area chart
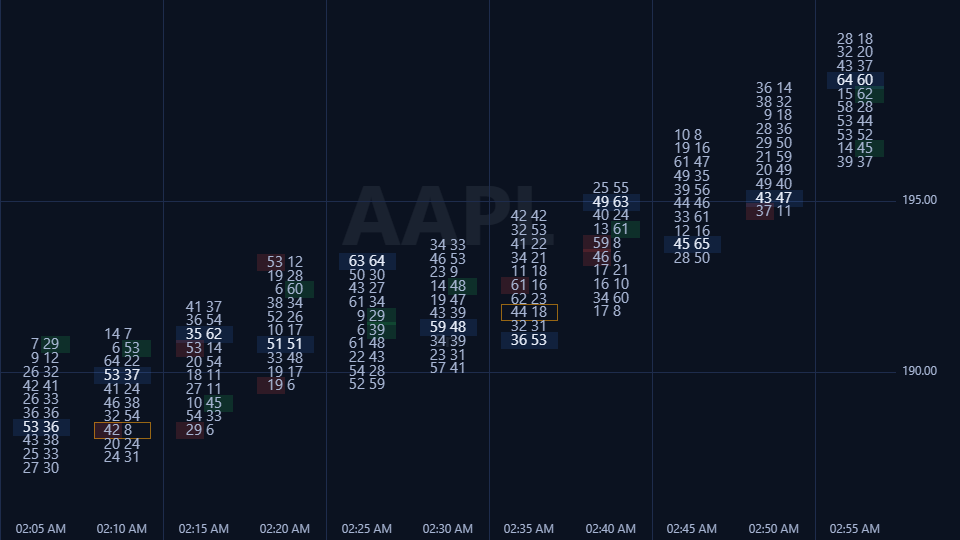
Footprint with bid and ask by price
Renko bricks
Renko bricks
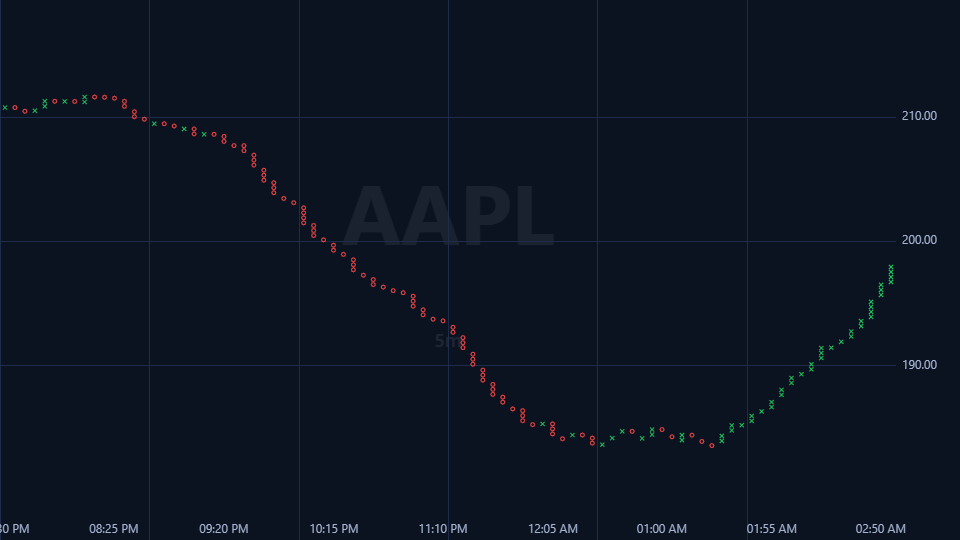
Point and figure
Point and figure

Full feature set

Every capability of the library

The full list in one place; scroll for the rest.

CapabilityWhat it gives
Render coreWebGL2 and Canvas 2D, target 60 FPS on a large series
Chart types13 draw types: candles, bars, line, area, baseline, histogram, step, Renko, Kagi, point and figure, Range, Line Break, Heikin Ashi
Timeframes22 from minutes to months
Indicators128 in 8 groups: overlays and oscillators
Drawing tools95 in 7 categories with history and templates
Volume profilePOC, value area, clusters and TPO letters
Order flowDOM ladder, time and sales, cumulative delta, footprint, volume bubbles
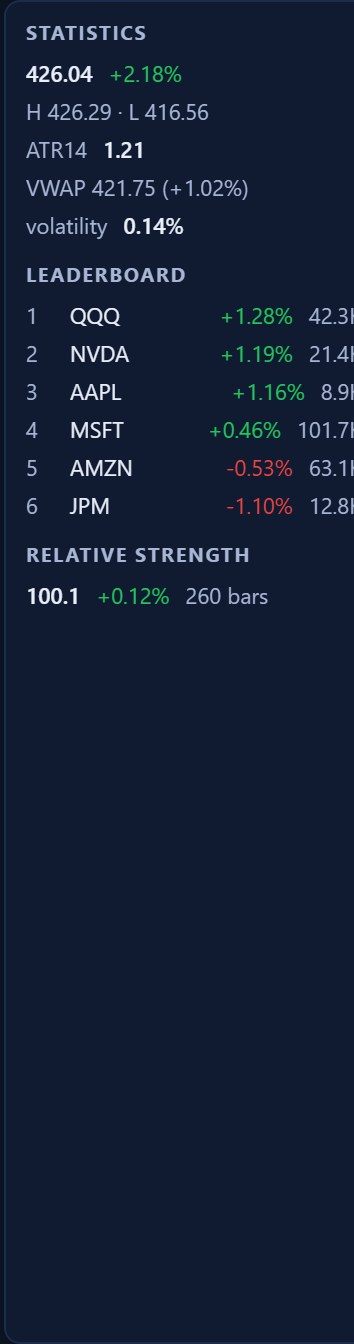
ComparisonUp to 10 series, leaderboard and relative strength
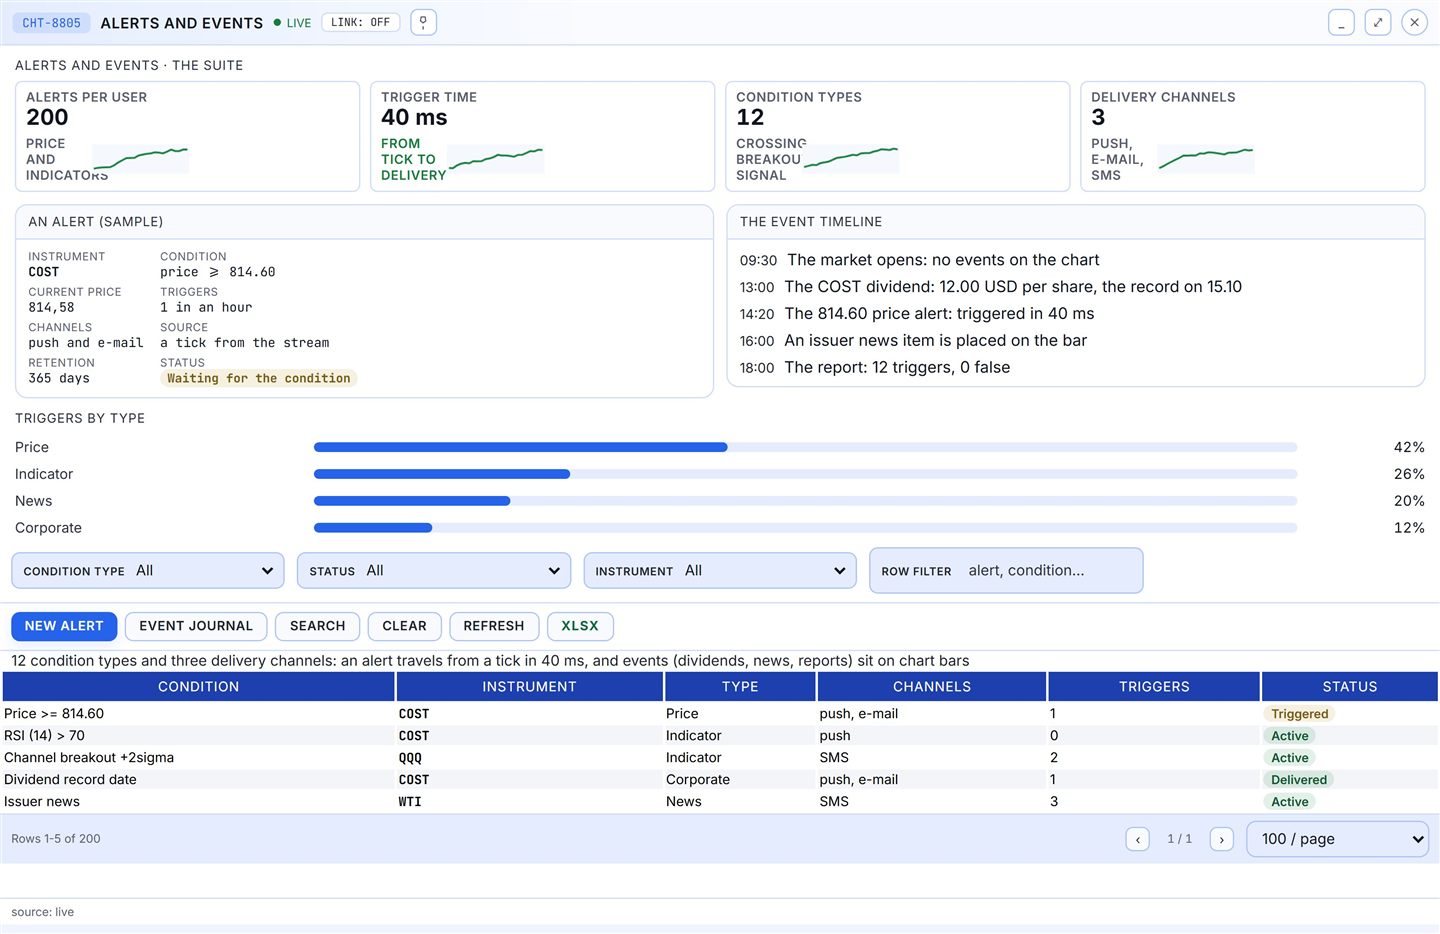
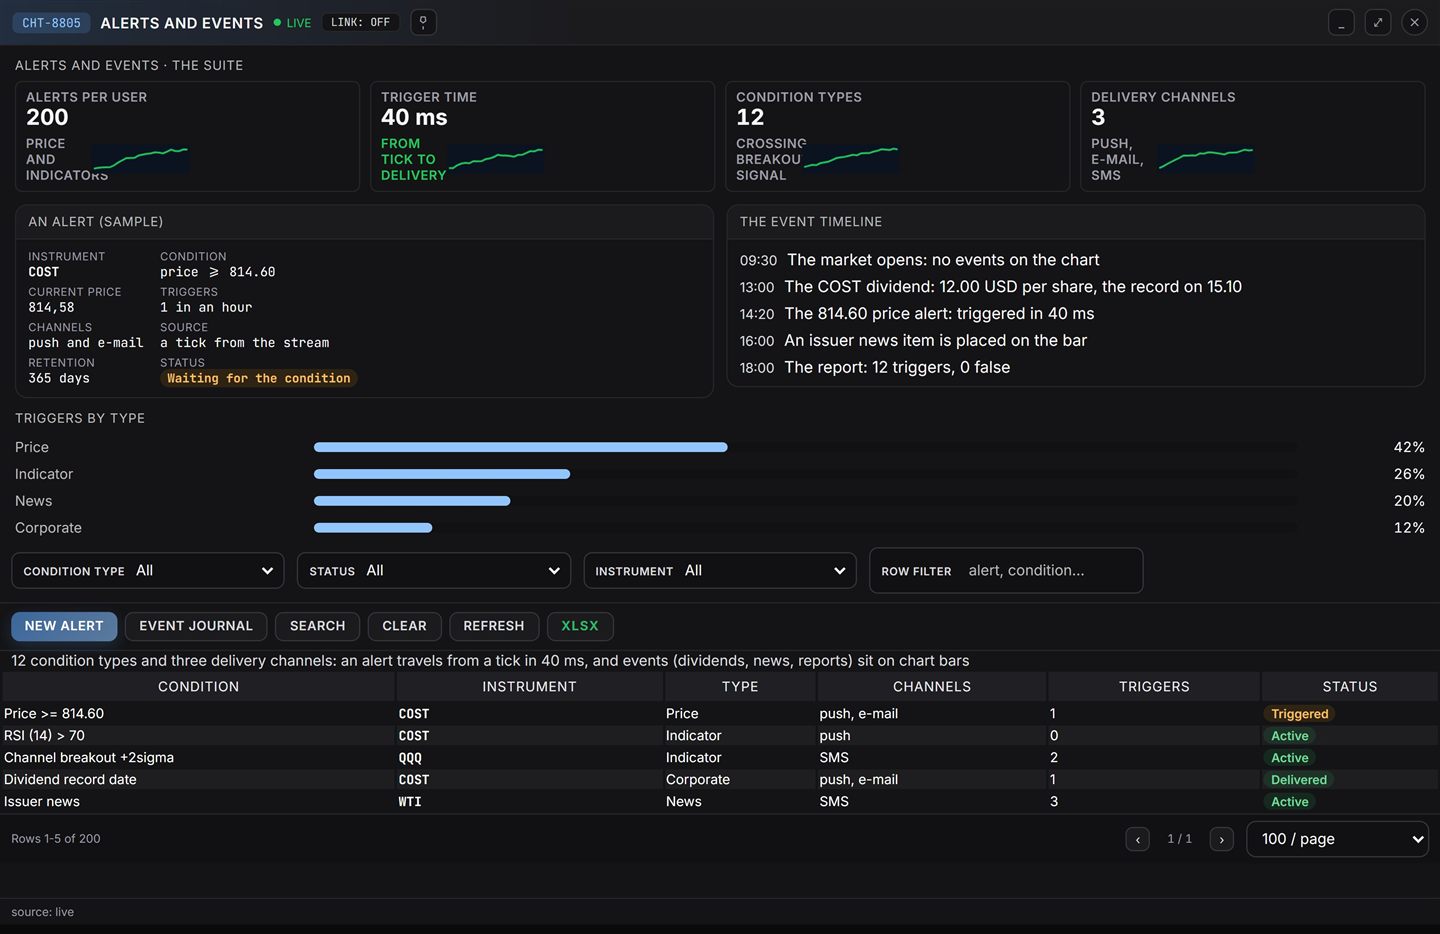
Alerts12 condition types, chains, delivery by e-mail, SMS and push
Trading from the chartLimit, market, stop-limit, take-profit, FOK and IOC; drag-stop
Replay and paperBar and market replay, paper trading, session journal
Multi-chartUp to 16 panels, LINK crosshair group, popout and share link
ScalesLogarithmic, percentage and index price scales
WorkspaceSaved layouts, object tree, command palette, focus mode and mini-map
ExportPNG snapshot, CSV of bars and trades, PDF day report
SDK180 methods, 62 target events; React, custom element and vanilla
Themes and localesDark and light themes; RU and EN
AccessibilityKeyboard-first, screen reader, 200% text scale
PerformanceStreams 50 000 ticks per second; 10 million bars with tiles and decimation
ProvenanceOwn code with permissive dependencies only, no foreign attribution

Figures follow the current library release.

In context

How the library compares

Against a minimal open widget and a closed pro library.

CapabilityUnifin ChartsLightweight widgetClosed pro library
Chart types13 in the coreOne typeSeveral types
Indicators128 in 8 groupsNone100+
Drawing tools95 with templatesNoneDozens
Volume profile and order flowIn the coreNonePartly
Replay and paper tradingIn the libraryNoneVendor platform only
Trading from the chartNative to the trading suiteNoneBroker API
Licence and codeOwn code, no attributionOpen, minimalClosed, attribution required
WeightHeavier than a minimal widgetMinimalHeavy

Comparison by capability class; no vendor is named.

Stand

Screens of the solution

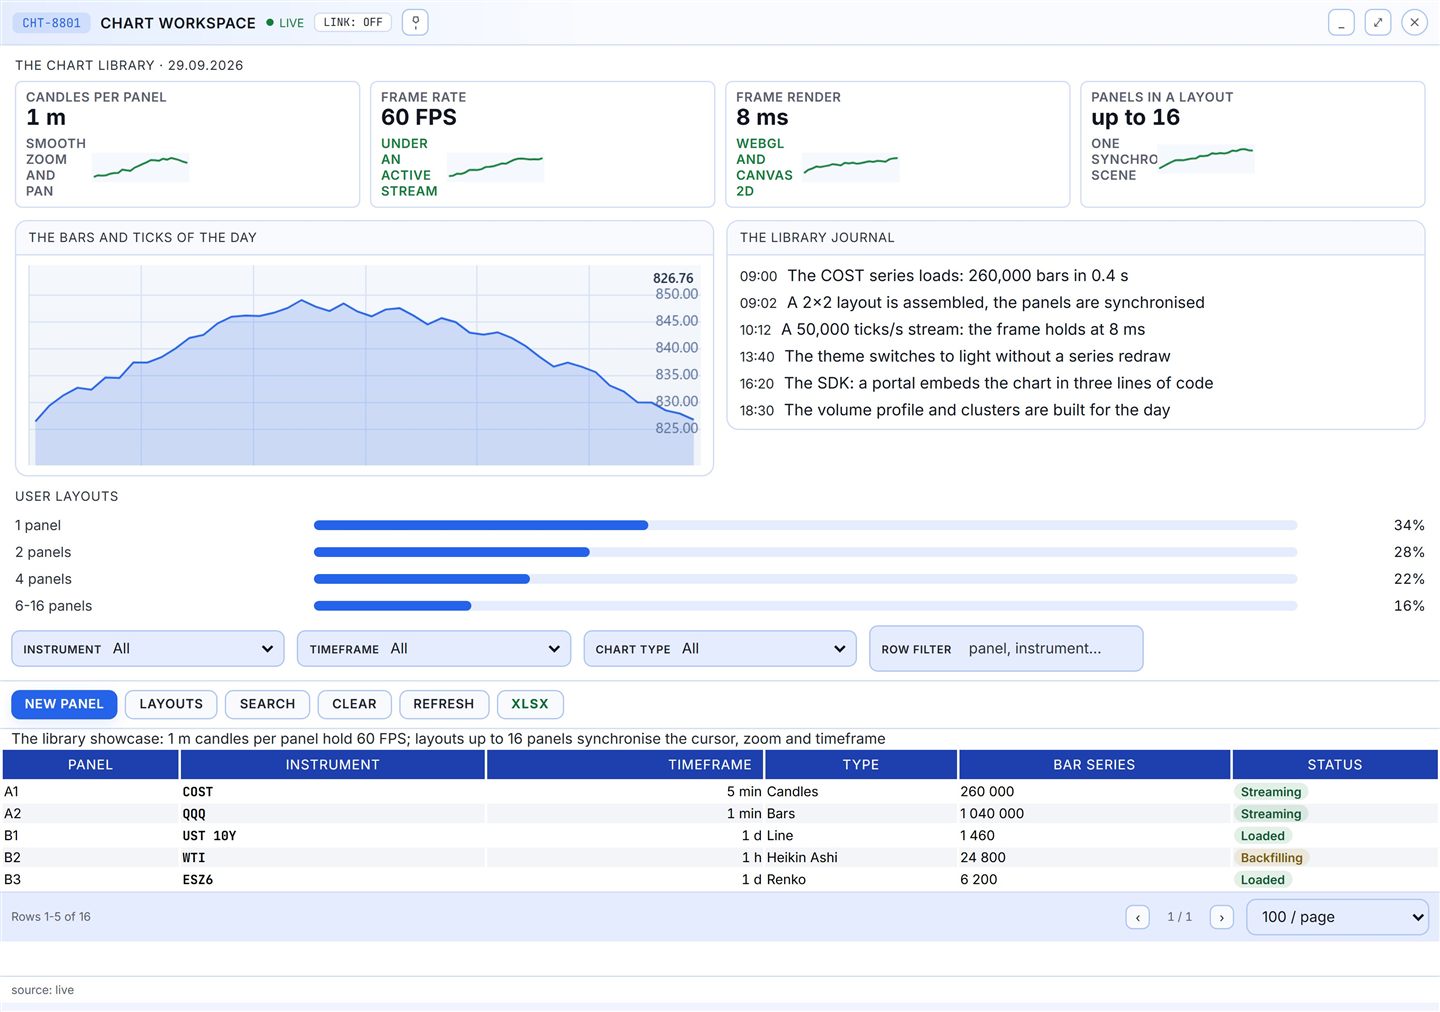
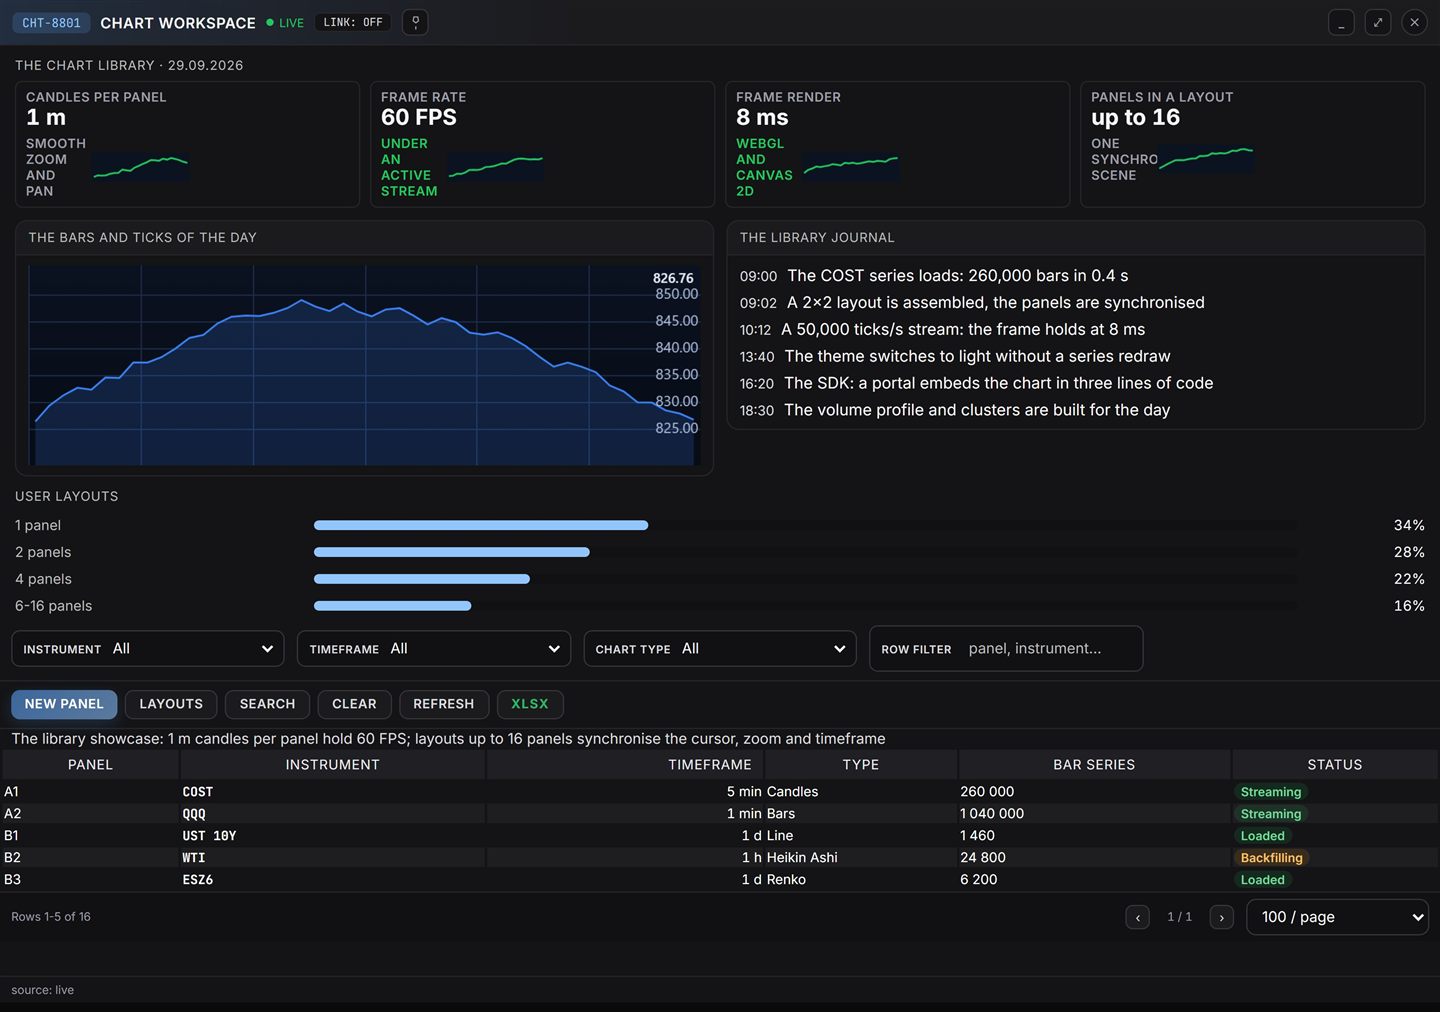
Chart workspace screen with panels of candles
Chart workspace: candles, panels and the events of the day
Drawing tools screen with a Fibonacci grid
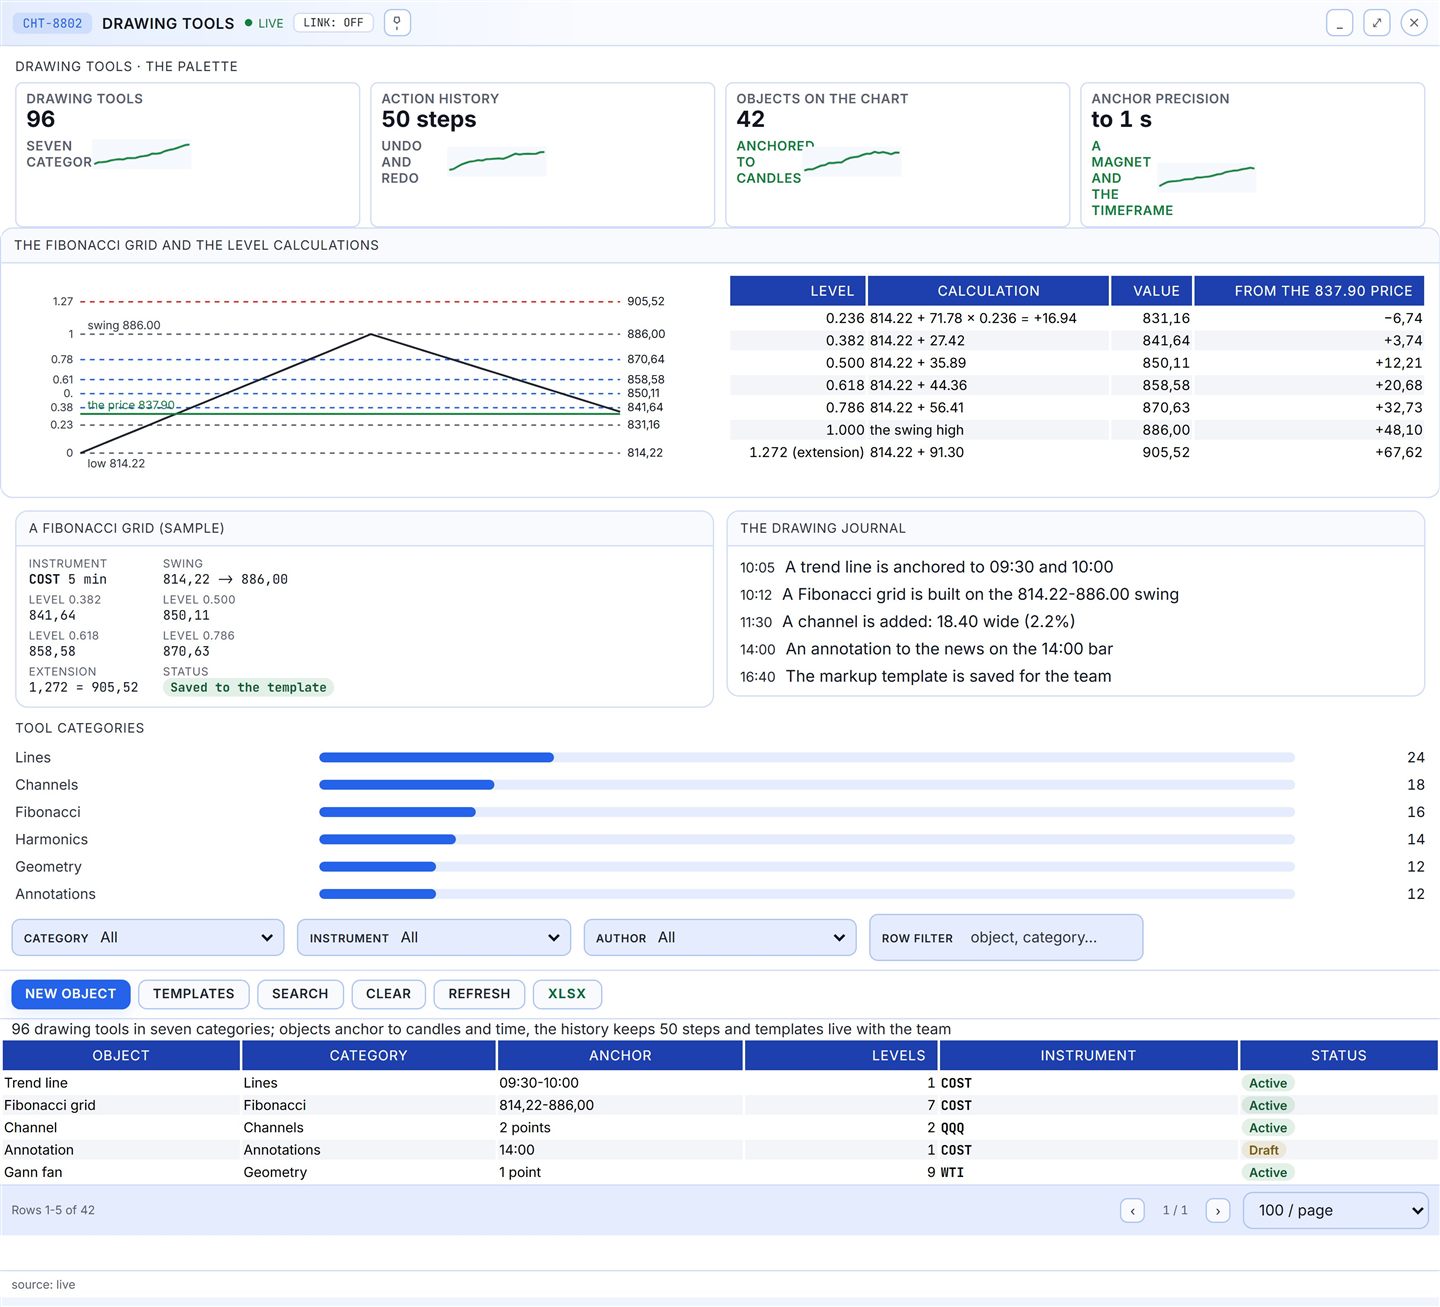
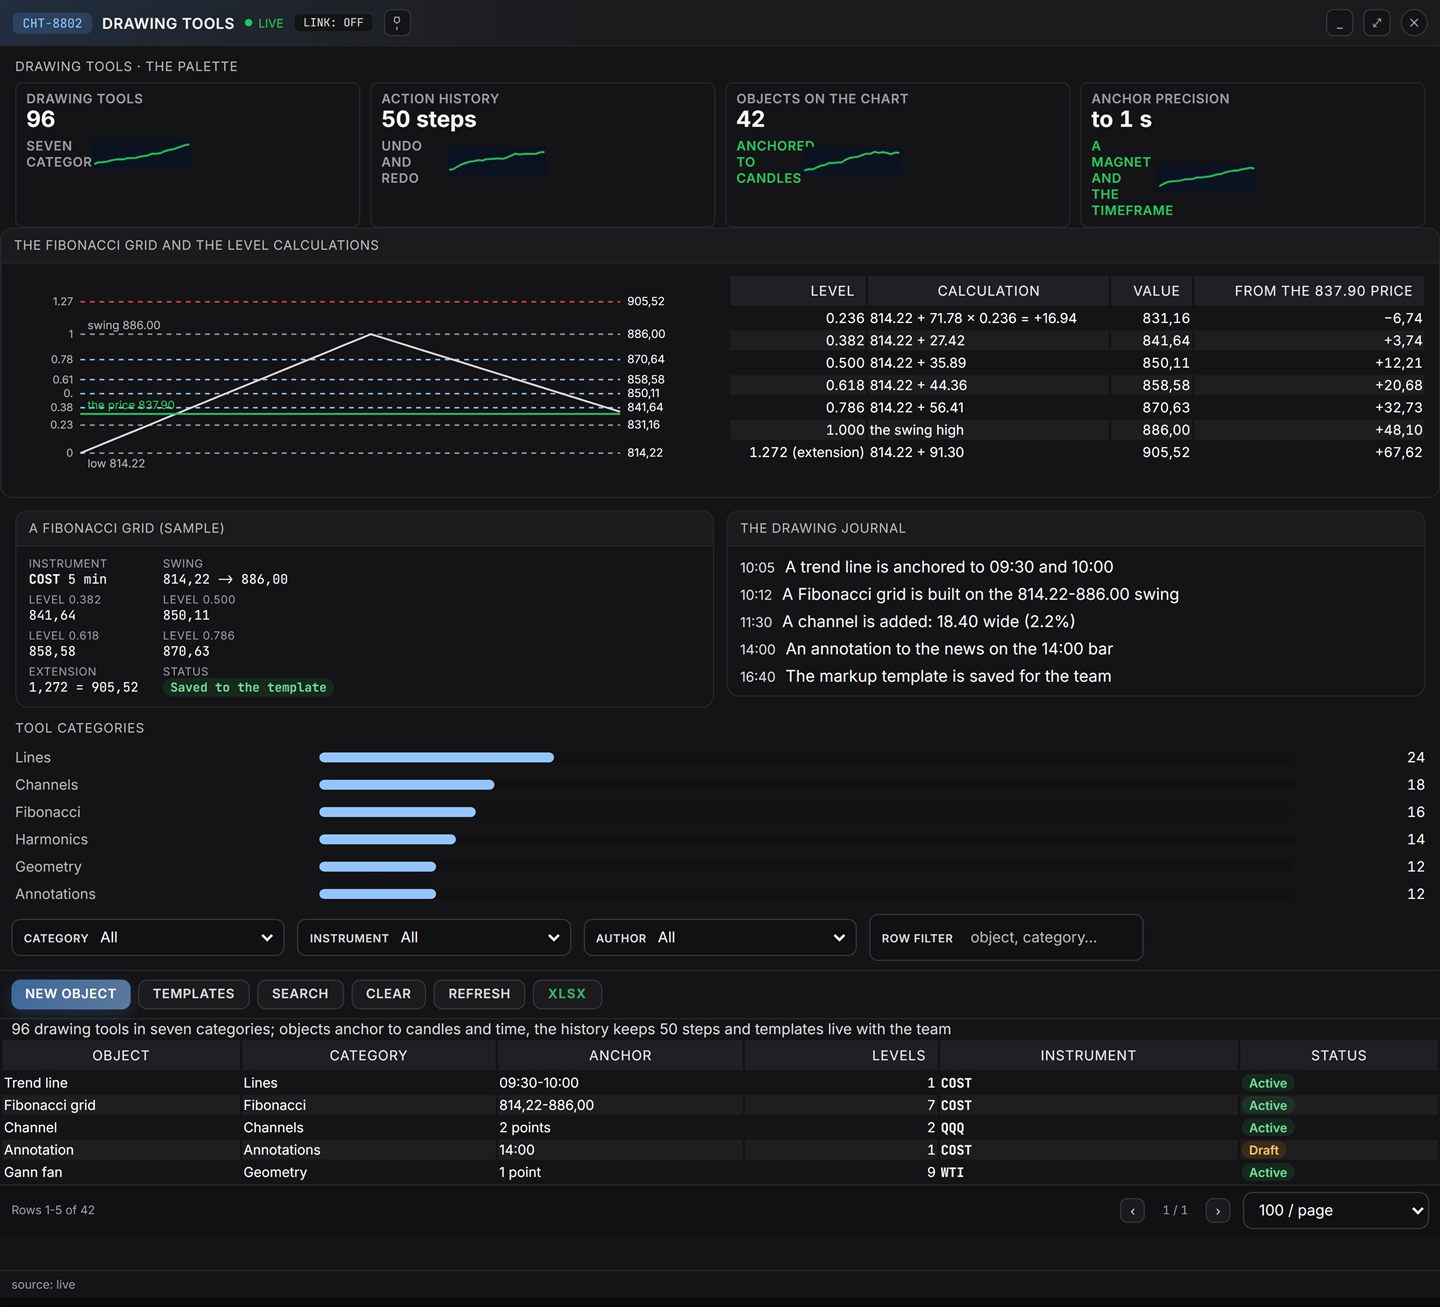
Drawing tools: the palette and a Fibonacci grid on the swing
Indicators and comparison screen with normalised series
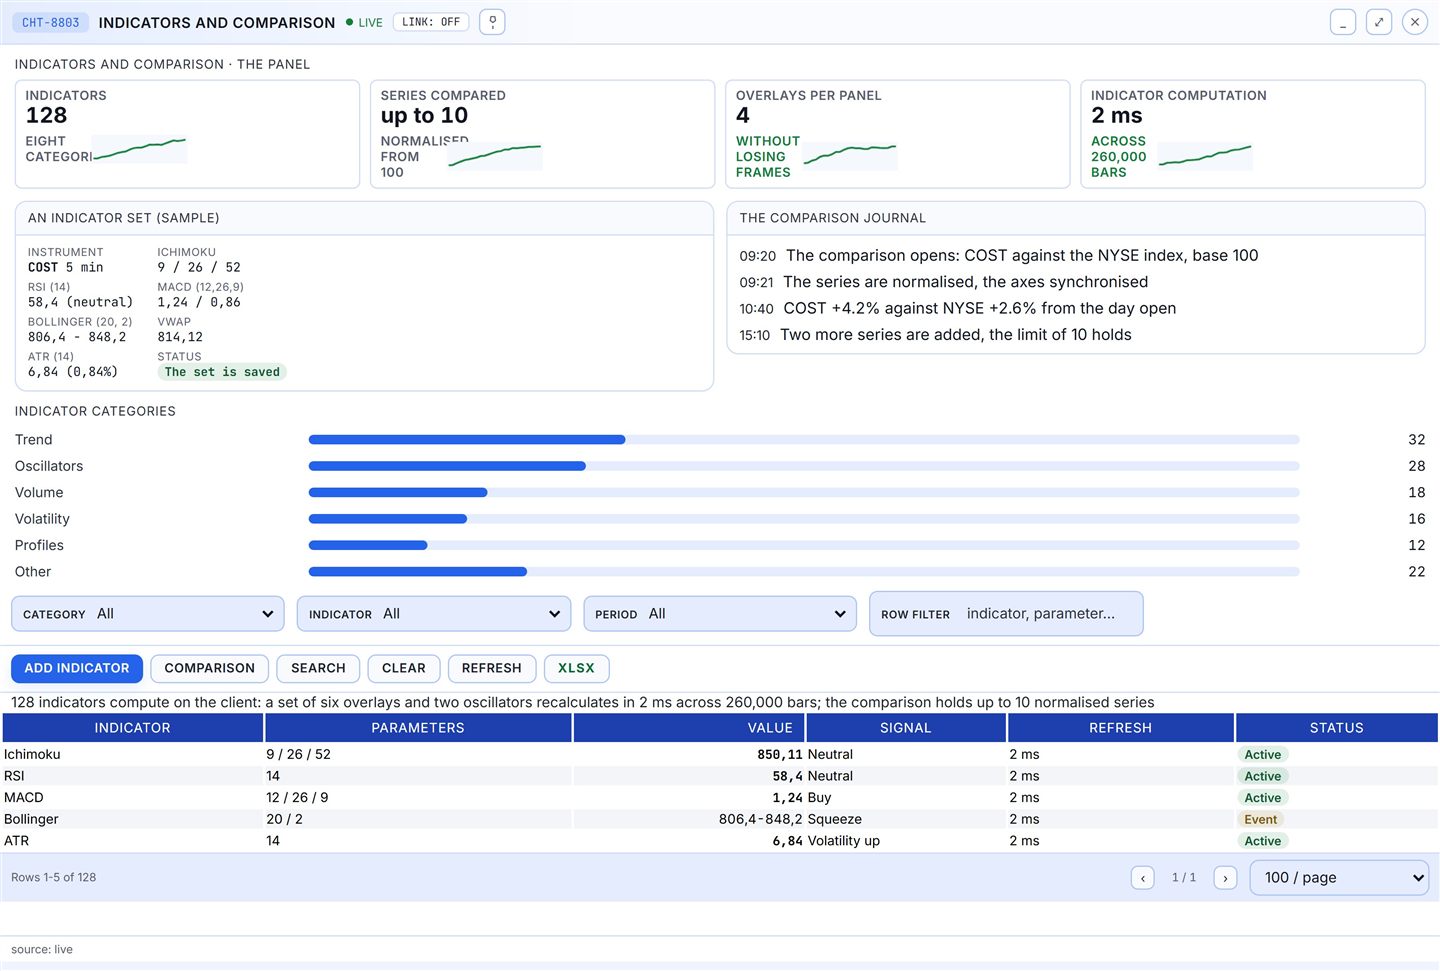
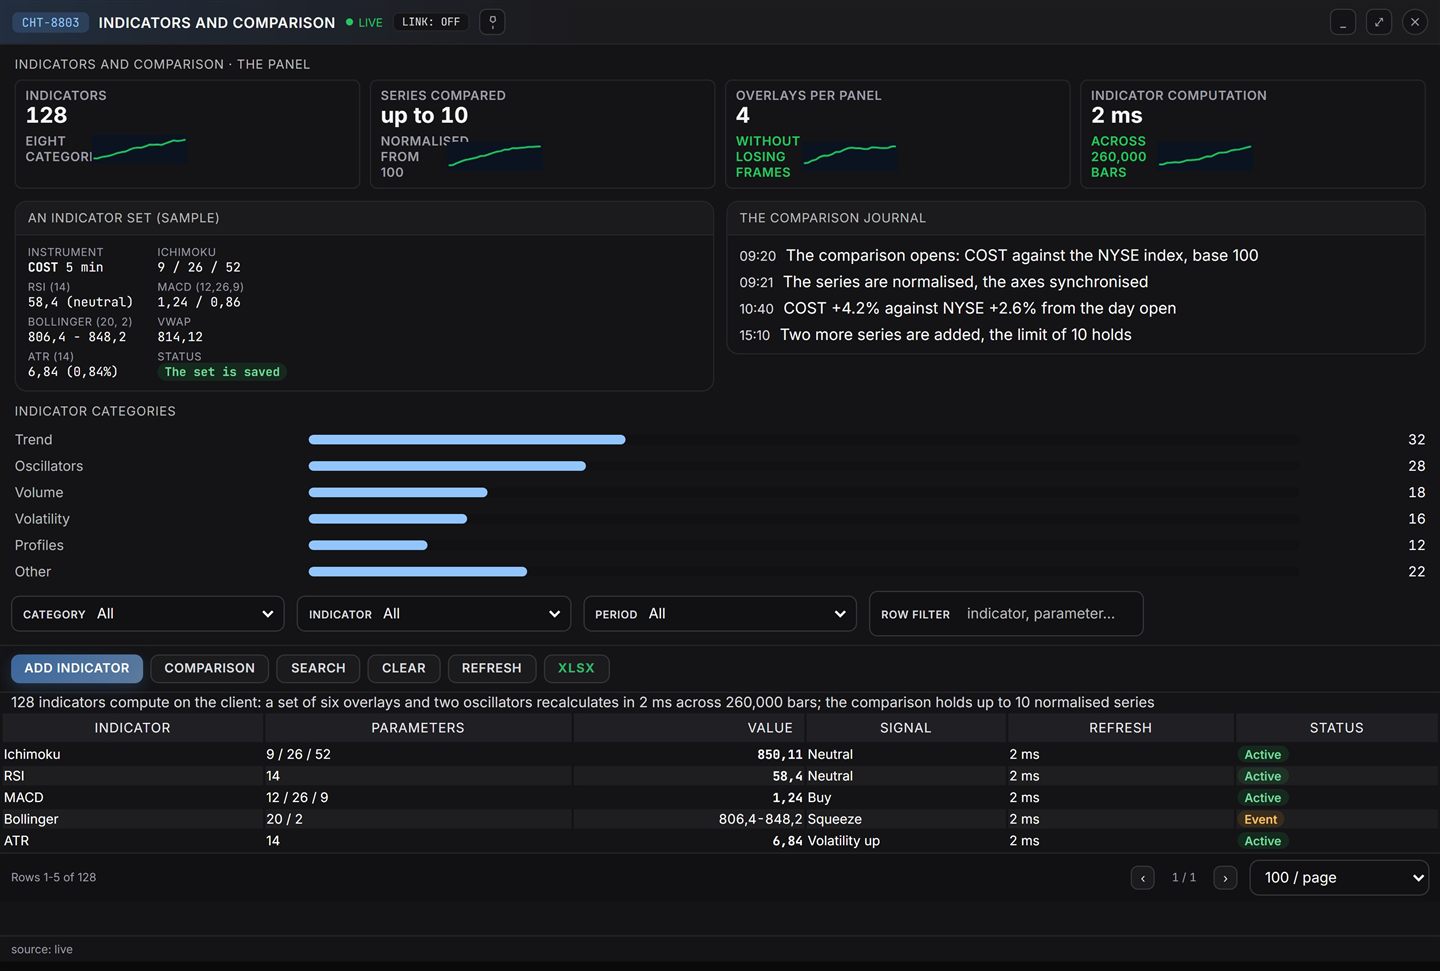
Indicators and comparison: overlays, oscillators and normalised series
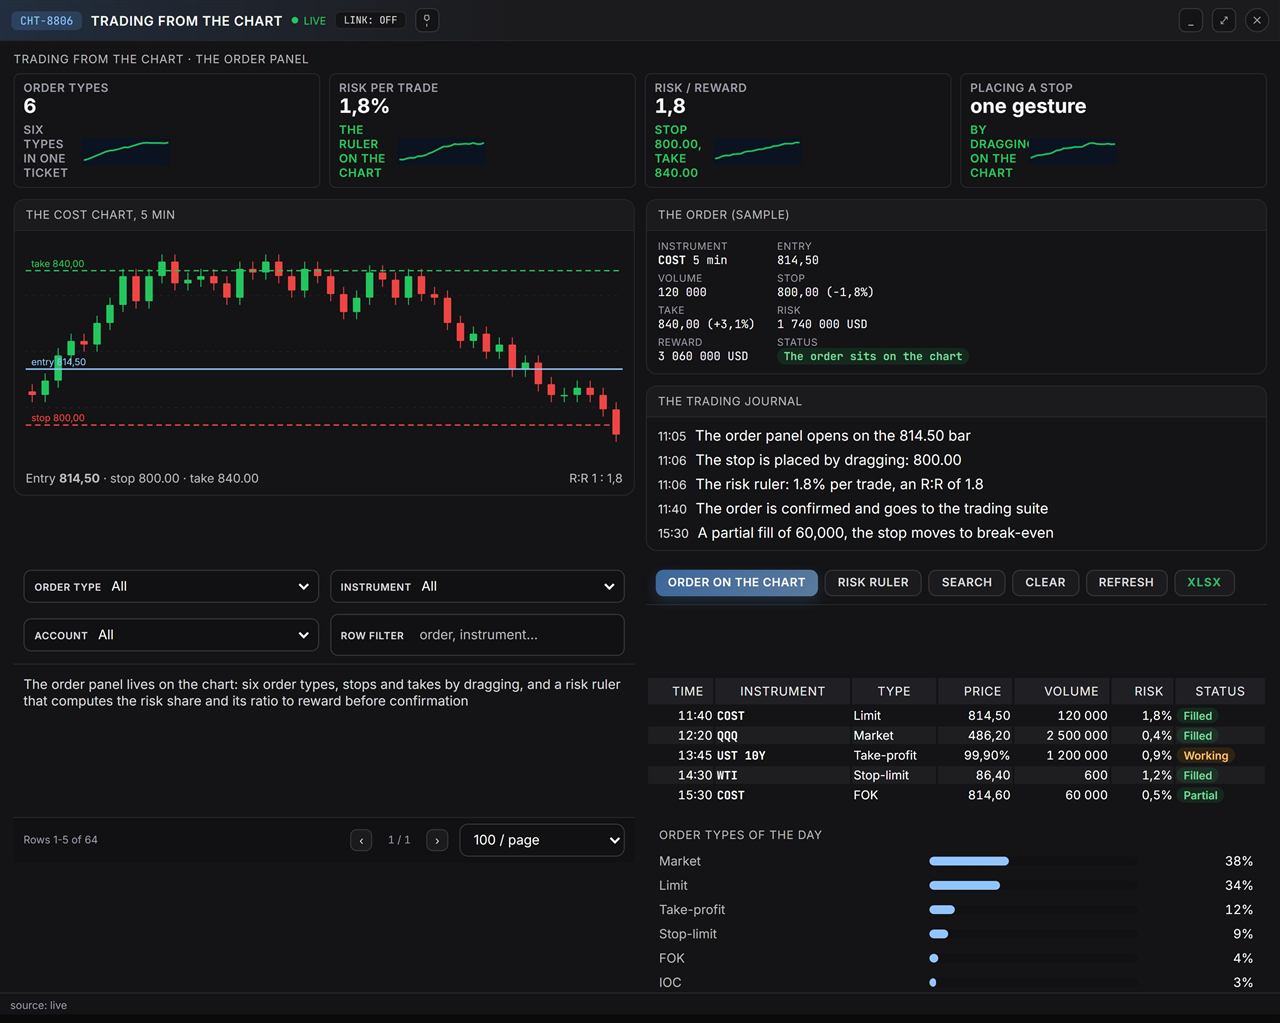
Trading from the chart: the order panel, the risk ruler and the day orders
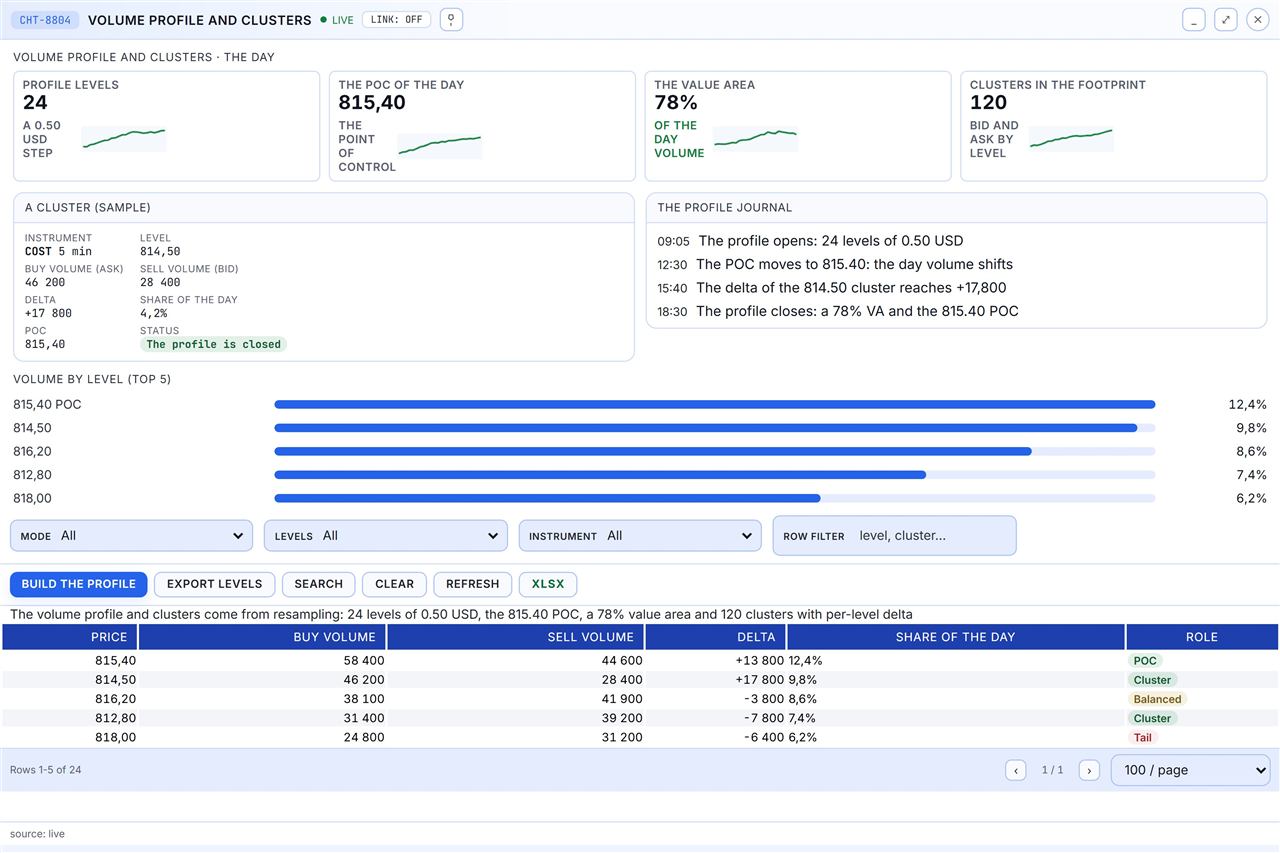
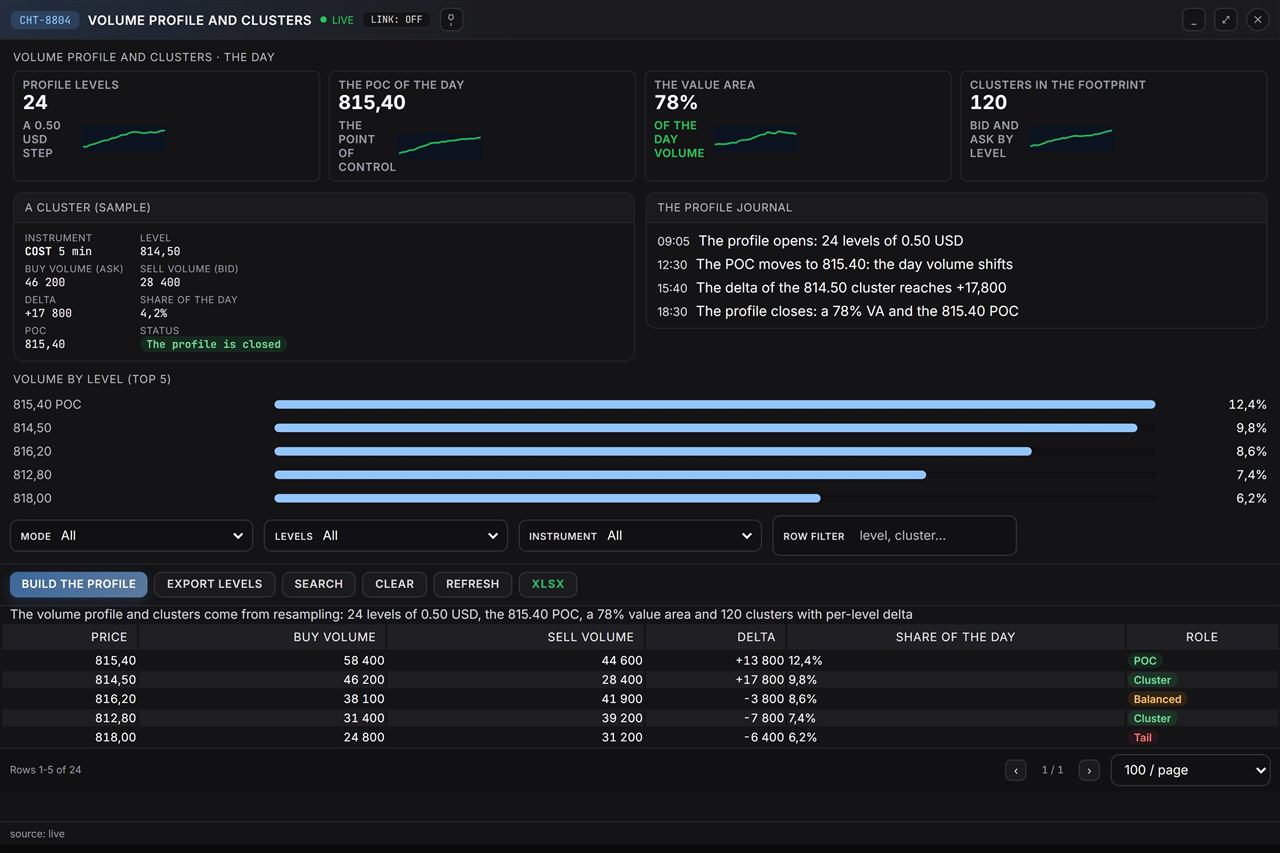
Volume profile and clusters: levels, POC and the day delta
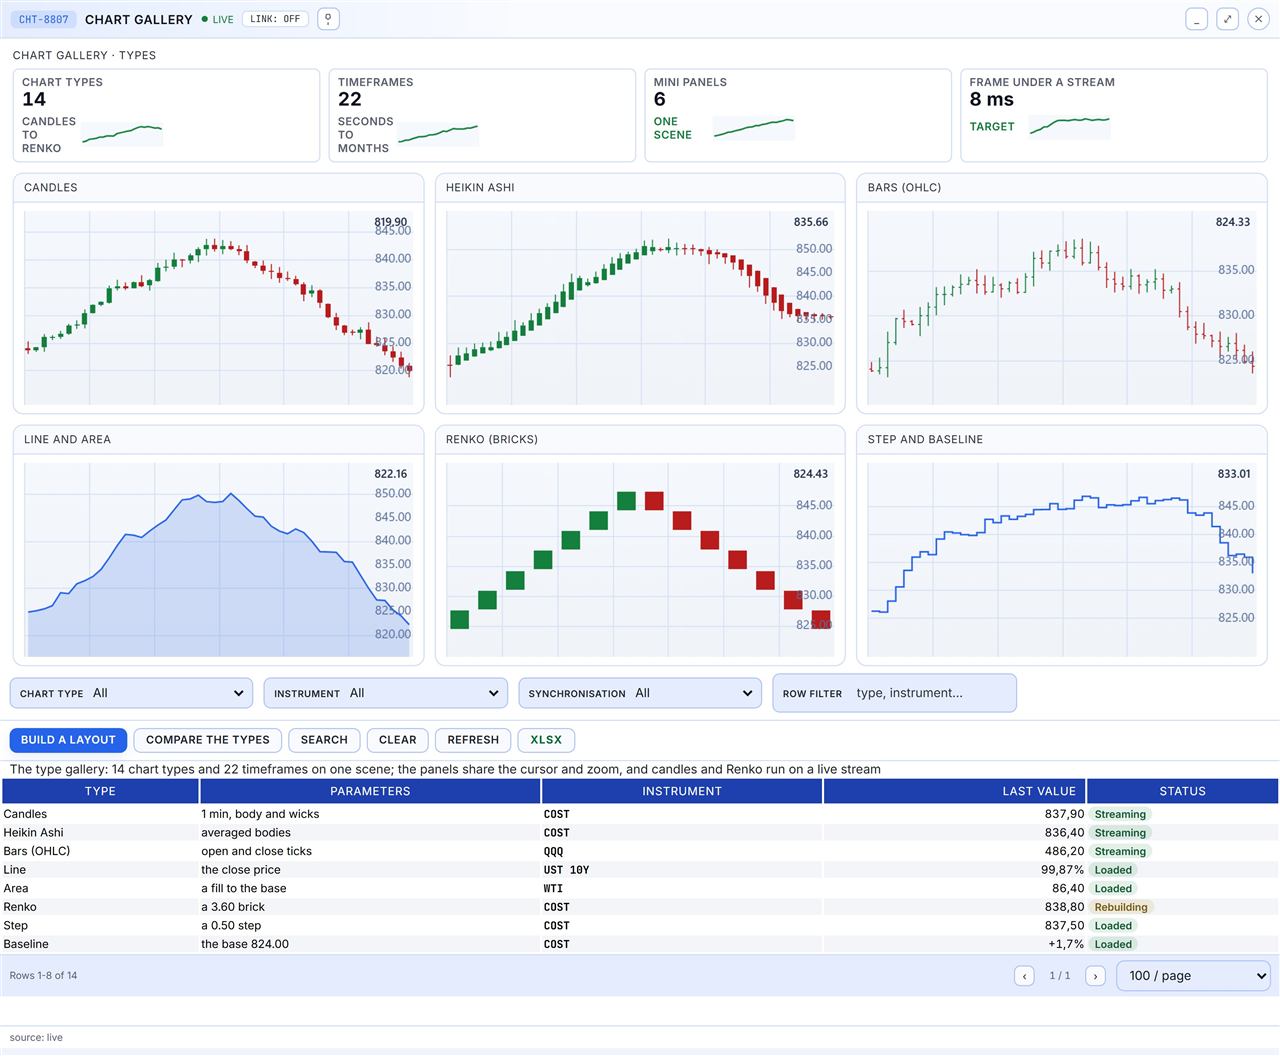
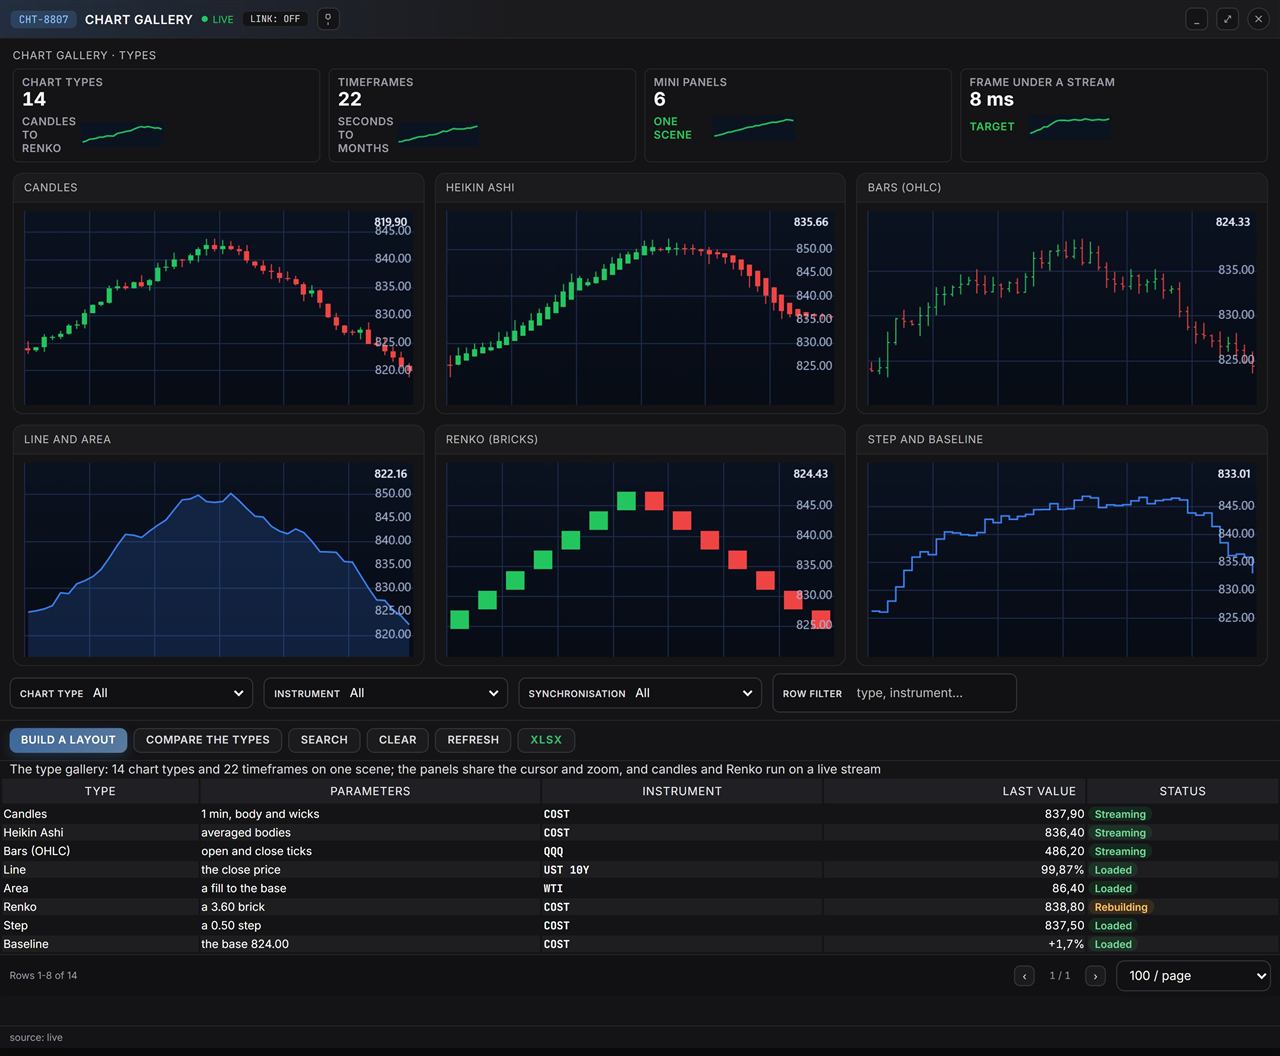
Chart gallery screen with six chart types side by side
Chart gallery: candle, bar, line, area, Renko and step types side by side
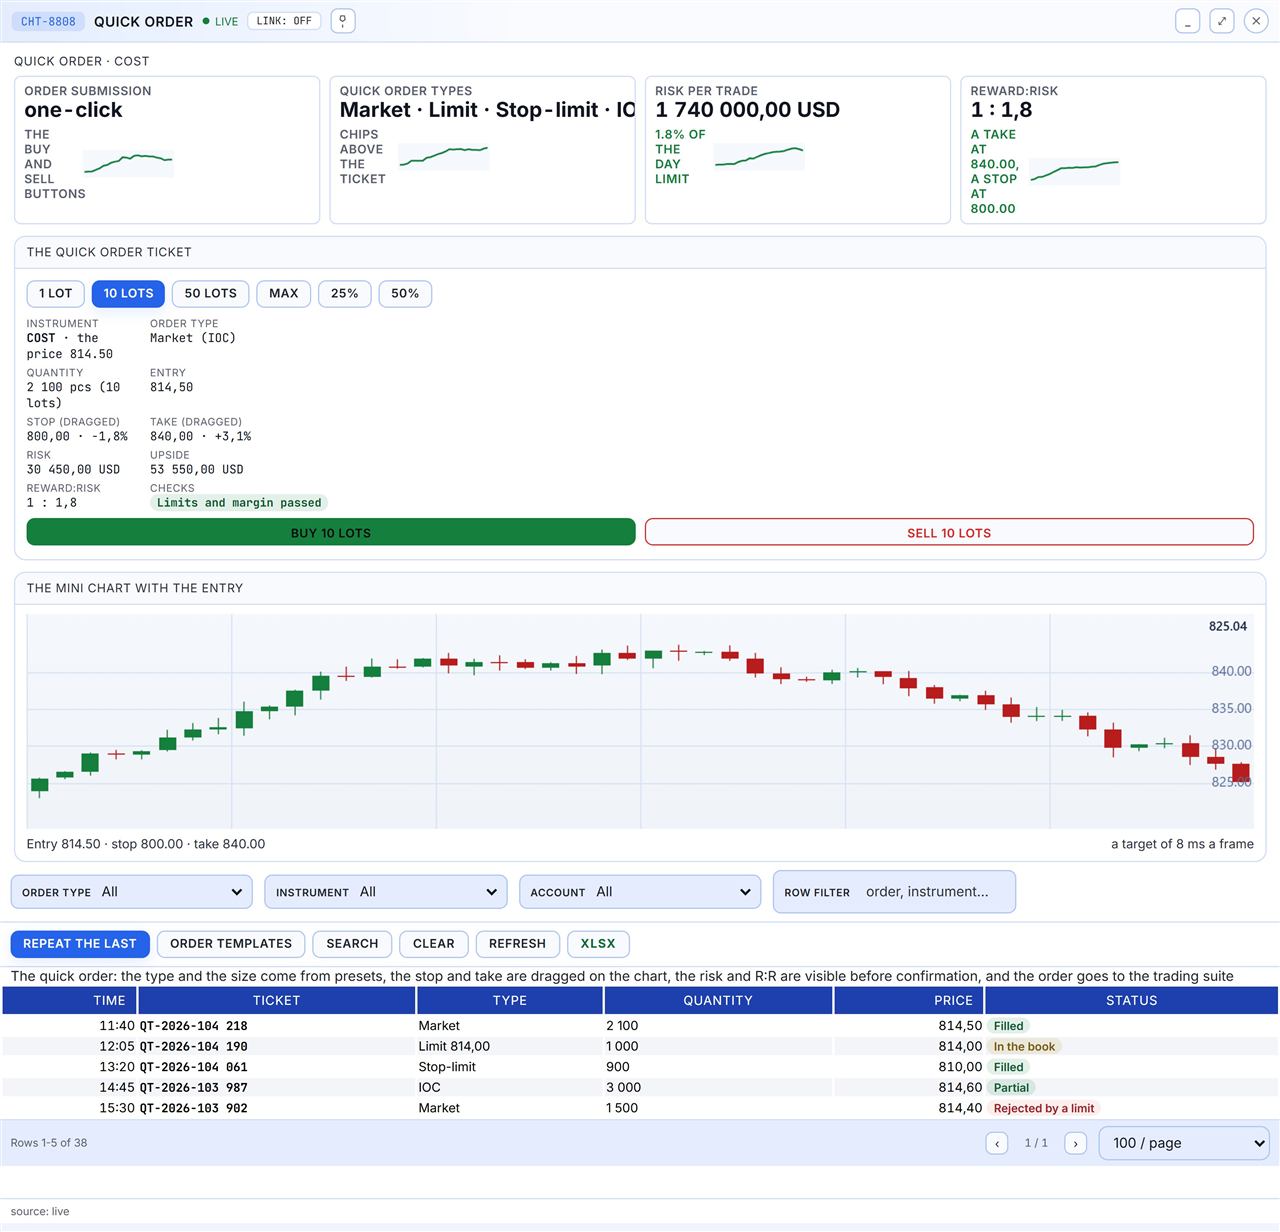
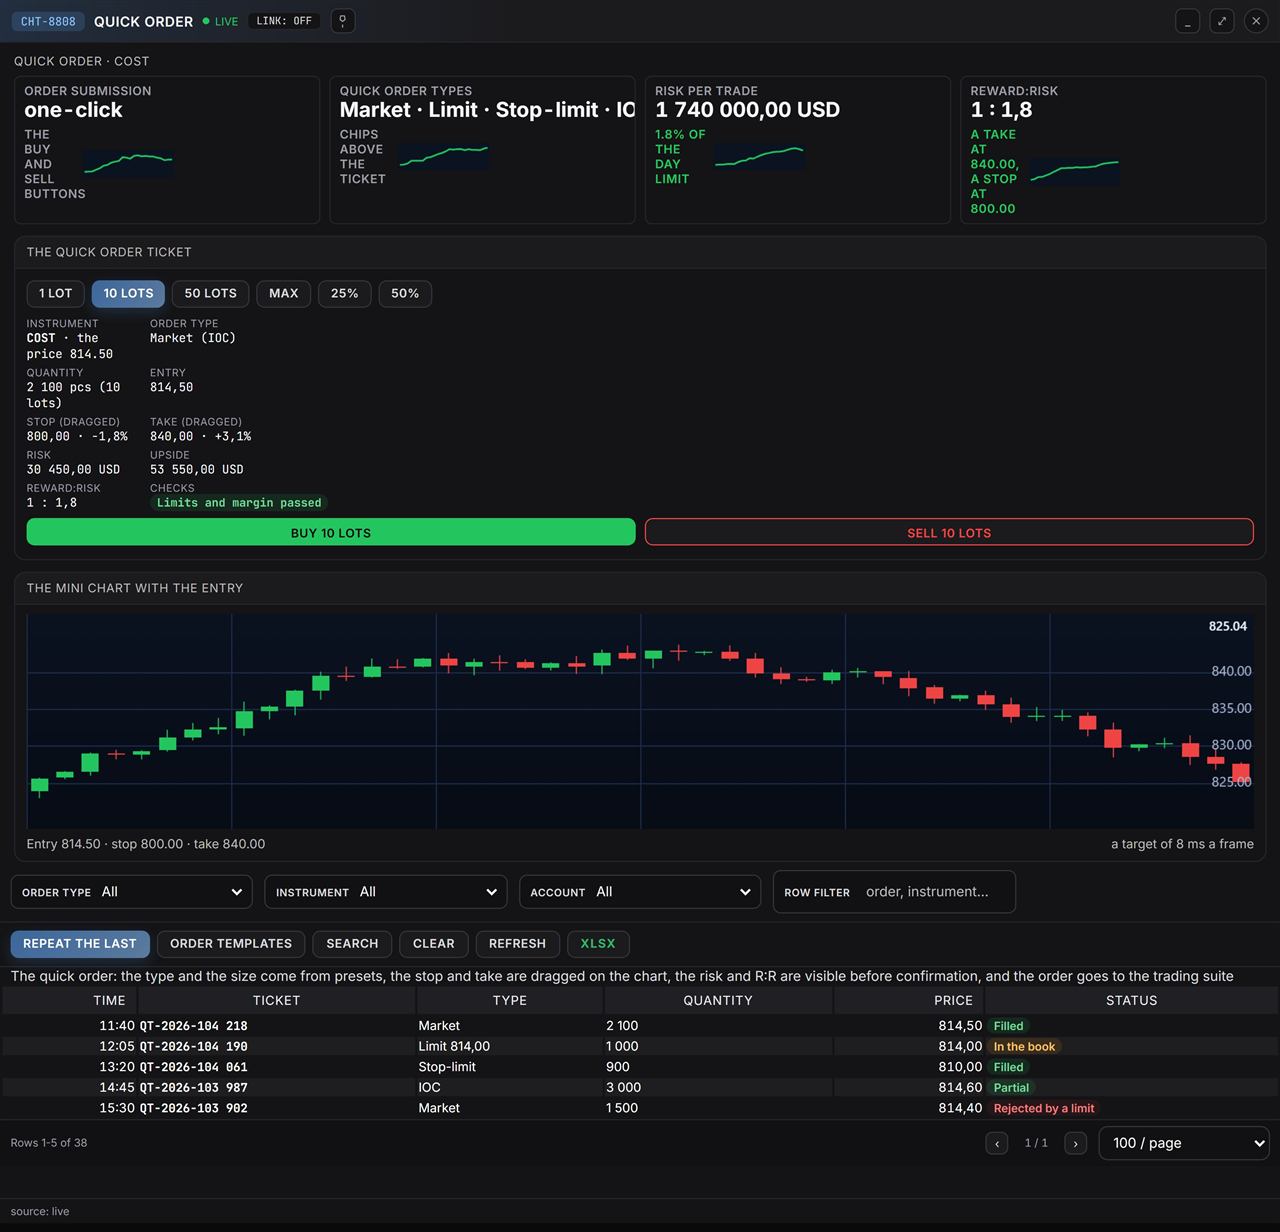
Quick order screen with presets and a mini chart
Quick order: presets, the stop and take on the mini chart, the risk before confirmation
Alerts and events screen with price conditions
Alerts and events: price conditions, delivery channels and the day triggers
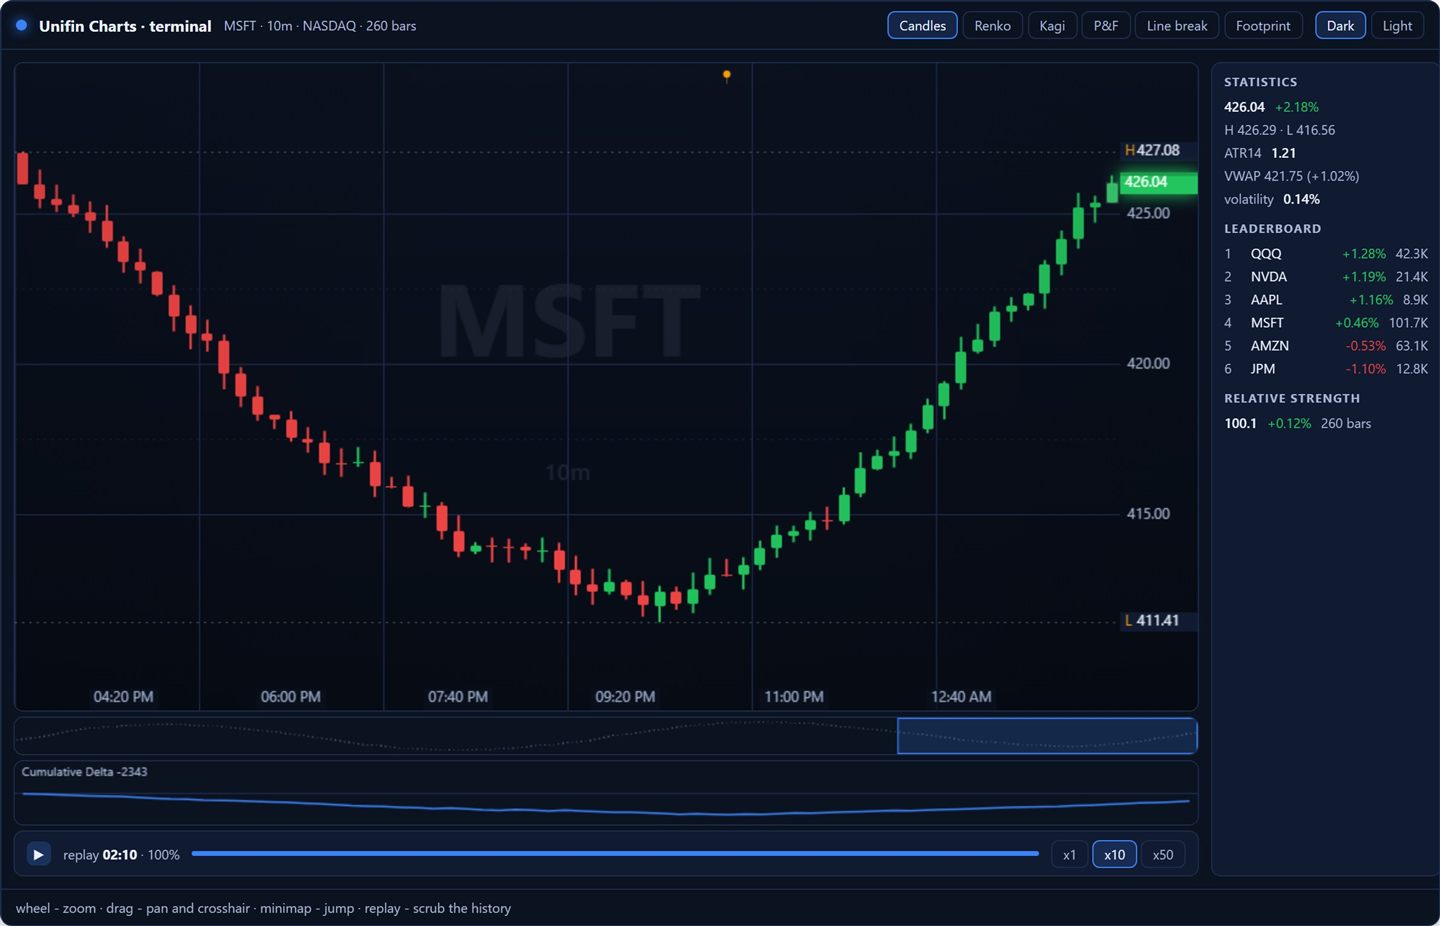
Pro terminal with chart types, the footprint and the replay
The Pro terminal: chart types, the footprint and the replay on one screen
Footprint panel with bid and ask by price
The footprint panel: bid and ask by price across the chart
Statistics, leaderboard and relative strength panel
Statistics, the leaderboard and relative strength beside the chart
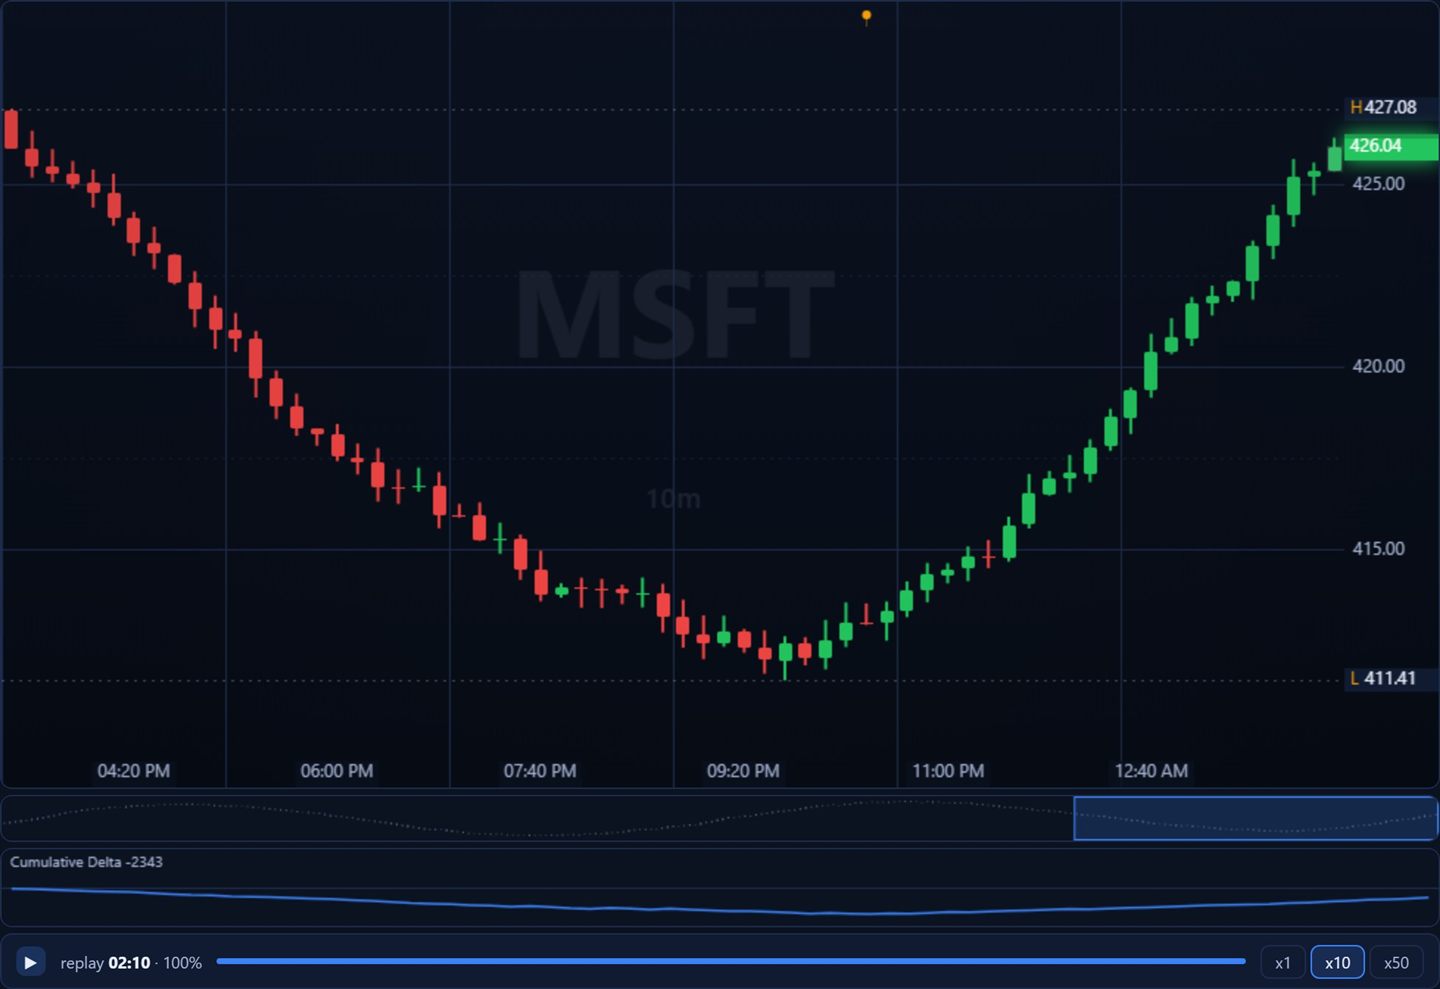
Cumulative delta and the replay timeline
Cumulative delta and the replay timeline under the chart

How it works

From data to a trade

One day: data, a frame, analysis, an event and a trade.

  1. 1

    Data arrives

    Ticks stream in, bars land in the cache.

  2. 2

    The frame builds

    Render target: 60 FPS, an 8 ms frame.

  3. 3

    Analysis unfolds

    Indicators compute on long series.

  4. 4

    An event fires

    An alert travels from a tick with a snapshot.

  5. 5

    A trade is placed

    The order goes from the chart, the stop moves.

Industries

Industries it serves

Exchanges, brokers, banks, asset managers, treasuries and product teams.

Exchange / venue

Trading, supervision, market data and post-trade on one governed core, launched by configuration.

Asset manager / fund

Analytics, indices and hedging instruments for portfolio and research teams.

Corporate / issuer

Market access for producers and issuers: auctions, deliveries, tokenised assets and data.

Fintech / data

Data products, AI services and API-first access to build on the platform.

Architecture

Architecture and access

The library core: render, data, indicators, drawing, alerts and trading.

Service suite

Data showcases and BFF, render, data adapters, indicators, drawing and trading.

External suites

FIX feeds, STOMP and SSE streams, providers and broker APIs come as adapters.

Multi-region and DR

Active-active reads, a DR region for Tier-0, clusters and database replication.

Extend without touching the core

A new feed or indicator pack joins through adapters and reference data.

AI layer

A daily summary and volatility flags; people approve every order.

Architecture scheme The same architecture as a standalone page. Open the diagram separately

Readiness

Ready today, next in line

Today the chart runs on lightweight-charts; the library extends it.

Ready today

  • Target: 1 m candles per panel at 60 FPS.
  • Target: a long series loads in under a second without pauses.
  • Indicators and drawing on long series (target: milliseconds).
  • The volume profile and clusters: the POC, the value area and delta

Next in line

  • Server-side rendering for very long history
  • Server-side alerts with the same conditions
  • Additional datafeed adapters (plan)

Releases

Release history

Quarterly releases since 2020; the chart library was built and opened in 2026.

2026 Q1

  • Indicators, drawing and the volume profile (plan).

2026 Q2

  • The render core on WebGL and Canvas 2D; chart types and timeframes from minutes (plan).

2026 Q3

  • The volume profile and clusters: the POC, the value area and delta.

2026 Q4

  • Server-side rendering and server alerts (plan).

Detailed description

Detailed description

The module map, the performance budget and the SDK reference.

How the suite is assembled

Channels and clients
FIX 4.2 / 4.4 / 5.0, REST with mTLS, SFTP files, web portals
Edge and access
API gateway with 126 routes, Keycloak single sign-on, WAF and CSP
Platform core services
chart-core (new) market-data-ms trading-ms notification-ms AI agentic layer Services of the suite on the shared platform core
Data and events
PostgreSQL 17 per service, Redis 7, RabbitMQ 3.13 quorum queues, transactional outbox
Results and reporting
Portals, reports, regulator and partner channels

Render and data

  • The render core runs on WebGL 2 and Canvas 2D with minute candles per panel; the render target is 60 FPS at an 8 ms frame (pilot targets).
  • Chart types cover every class of asset; timeframes run from a second to a month, including Renko and Heikin Ashi.
  • Long bar series load in under a second while tick streams keep flowing, with reconnect (pilot target: sub-second load).
  • Multi-panel layouts synchronise the cursor, the zoom and the timeframe.

Drawing tools

  • A full toolset across categories: lines, channels, Fibonacci, harmonics, geometry and annotations.
  • Objects anchor to candles and time to a second; the magnet snaps to the nearest high or low.
  • A Fibonacci grid on a swing marks the classic retracement levels (example levels: 841.64, 850.11, 858.58, 870.63).
  • A full edit history, team templates and a share link keep markup reproducible.

Indicators and comparison

  • A rich library of overlays and oscillators; computation stays in the milliseconds across long series (pilot target: milliseconds).
  • The sample set (example readings): Ichimoku 9/26/52, RSI 58.4, MACD 1.24/0.86 and Bollinger 806.4-848.2.
  • Comparison normalises series from base 100 with synchronised axes: COST against the external NYSE Composite index connected as a provider (the platform indices from indices-ms are the in-suite alternative); the readings are example data.
  • Set parameters keep their version and are visible to the team.

Volume profile and clusters

  • Resampling builds the profile levels with a chosen step, the POC and the value area.
  • The footprint holds clusters with bid and ask executions by level.
  • A cluster at 814.50 shows the delta and its share of the day (example data: +17,800 at 4.2%).
  • The profile keeps its session and step: snapshots are reproducible.

Alerts and trading from the chart

  • Conditions on price and indicators with channels (push, e-mail, SMS) through the platform notification suite (notification-ms); an alert travels from a tick in tens of milliseconds (pilot target).
  • Corporate events (dividends, records, news) sit on chart bars with a journal.
  • Order types: limit, market, stop-limit, take-profit, FOK and IOC (the trading-ms catalogue).
  • The risk ruler shows the risk and the R:R before confirmation; stops and takes move by dragging.

Architecture and the SDK

  • The core is built from platform services: the render core, datafeed adapters, analytics and the trading layer behind a portal BFF.
  • Feeds (FIX 4.2/4.4/5.0; STOMP/WebSocket and SSE), providers and external gateways (esb-gateway-ms, unifin-fix-gateway-java) connect as adapters; orders go to trading-ms; the library does not duplicate their books.
  • The product SDK (planned for the pilot; TypeScript 5 on the portal stack) embeds the chart into a portal in a few lines of code.
  • Evidence by default: series loads, markup changes, alerts and orders are kept in the platform event journal (a long retention with a hot tier).
Detailed description

Leave your contacts to open the detailed description and download the PDF with architecture, cases and delivery details.

Ask about the chart library

One instrument: we will show the path from data to a frame and from an alert to an order.