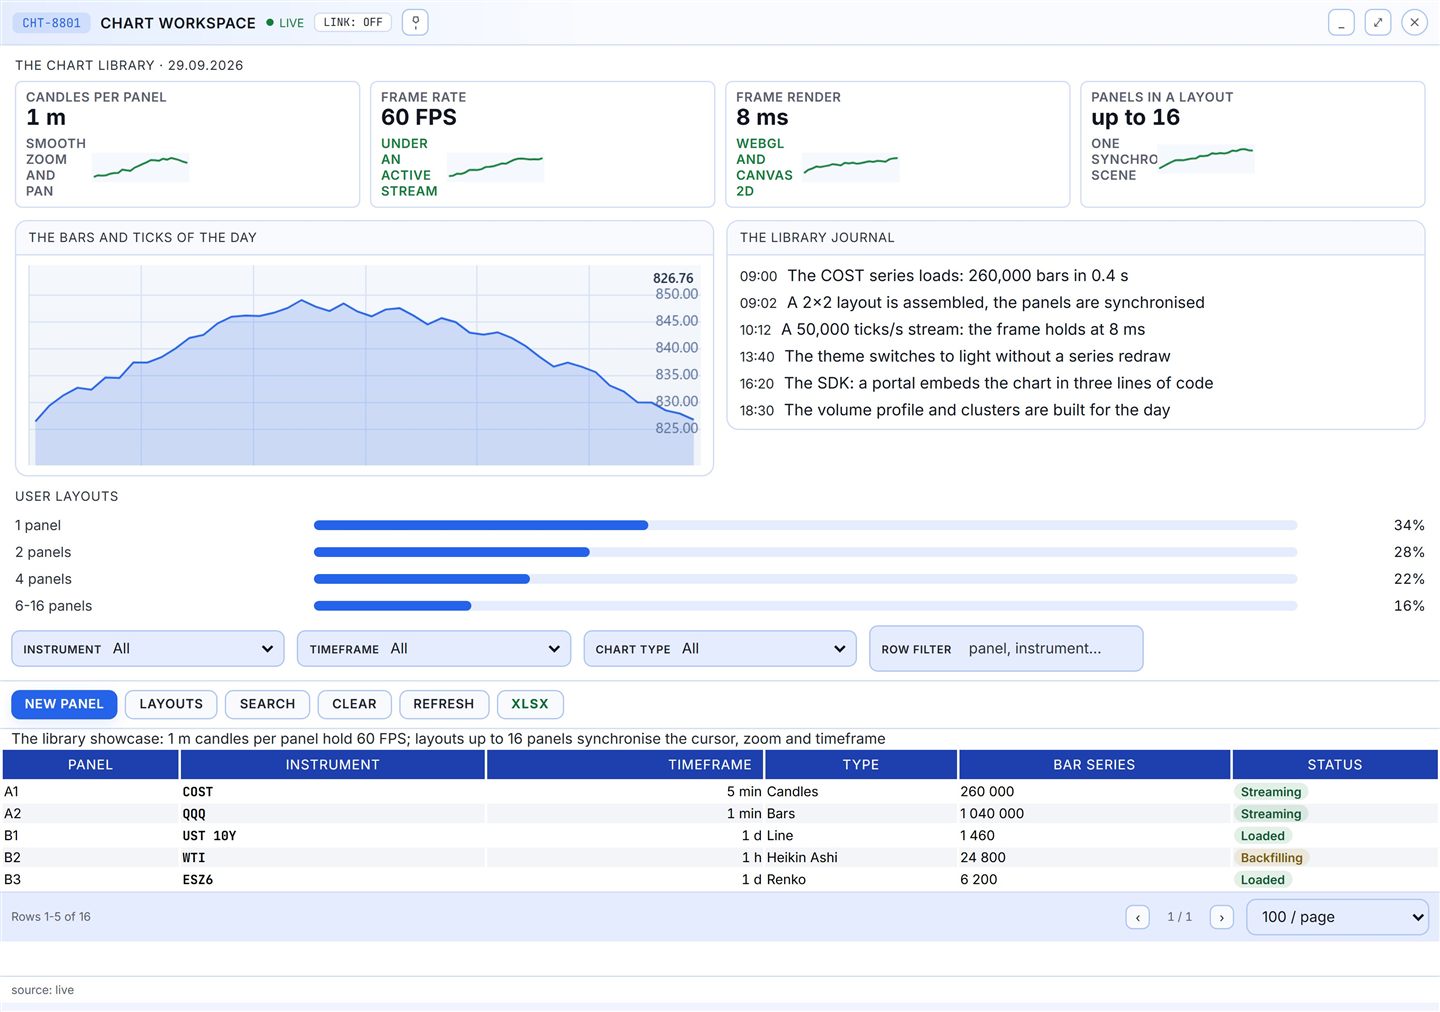
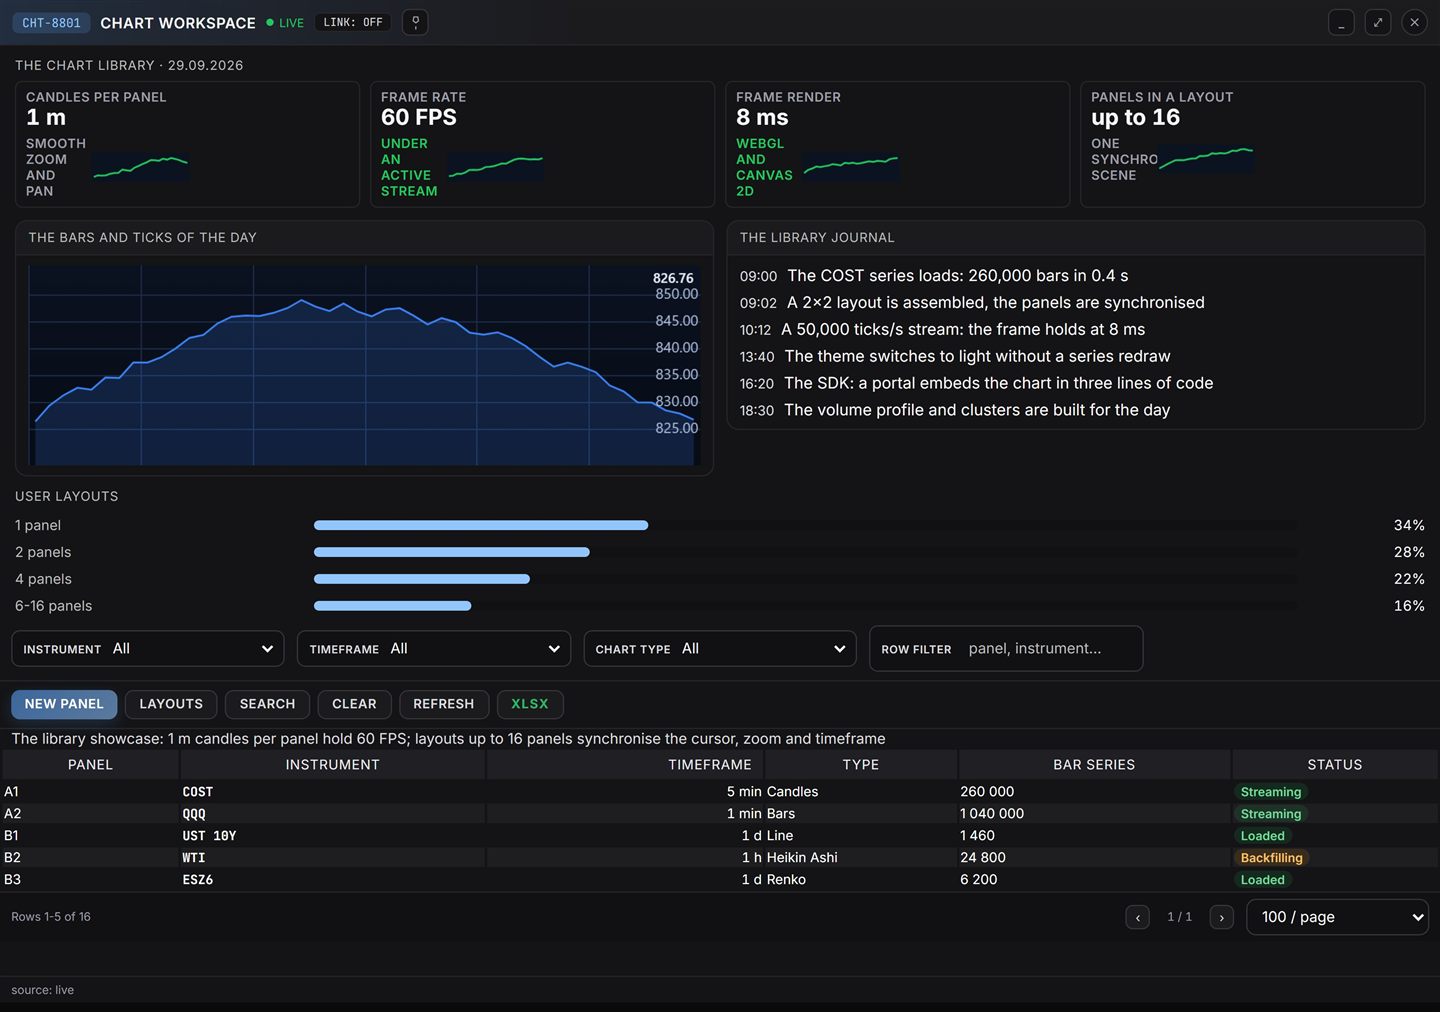
| Render core | WebGL2 and Canvas 2D, target 60 FPS on a large series |
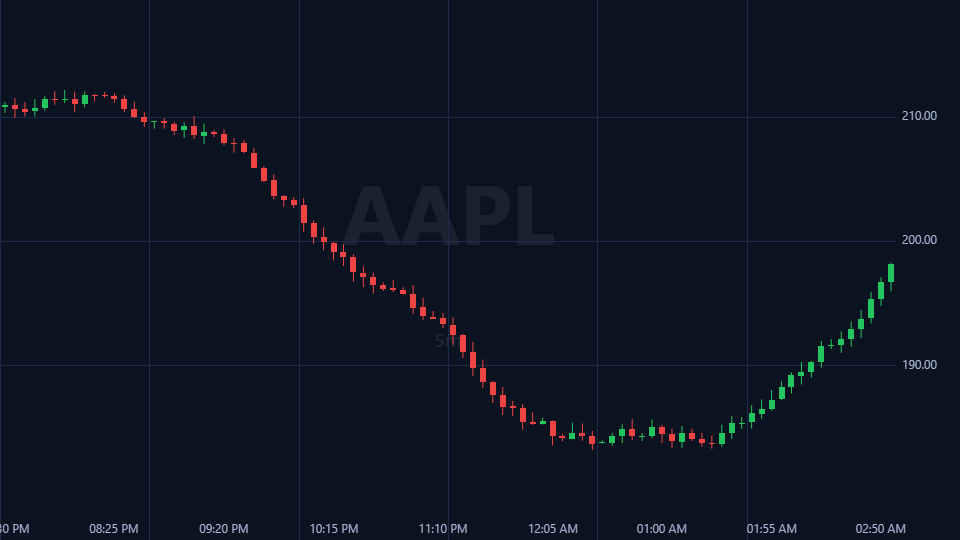
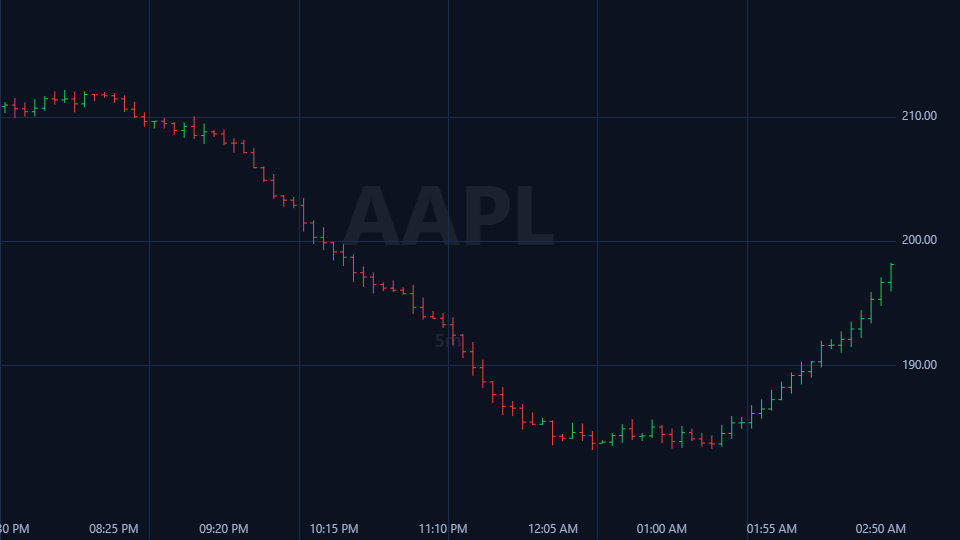
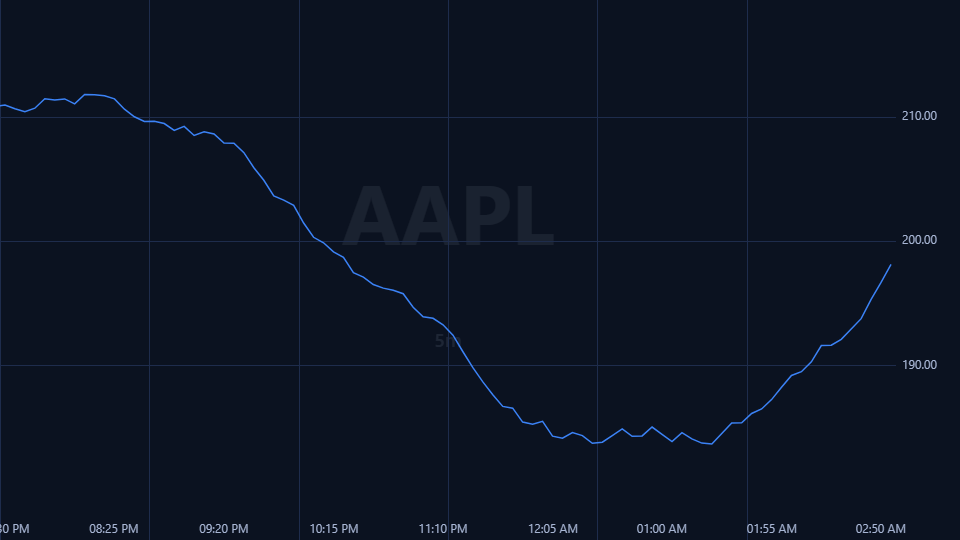
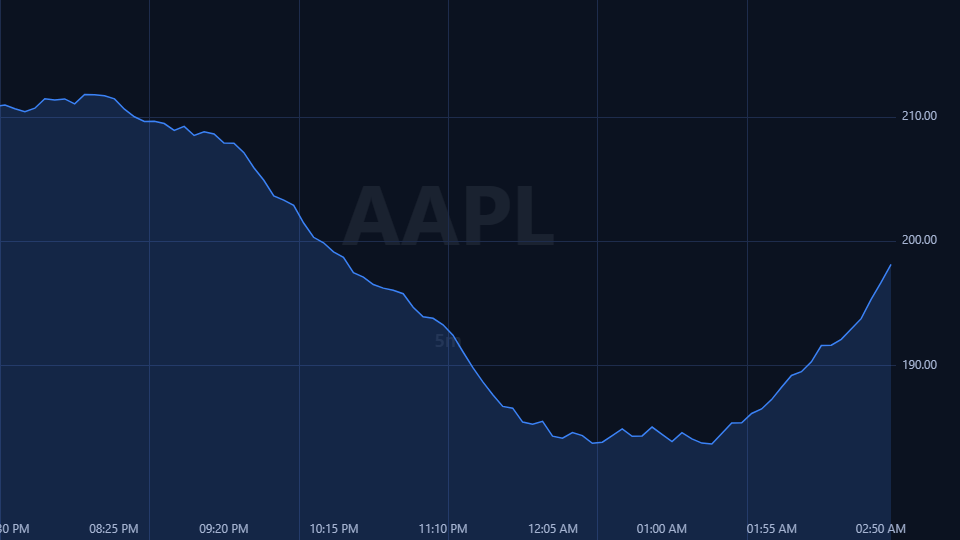
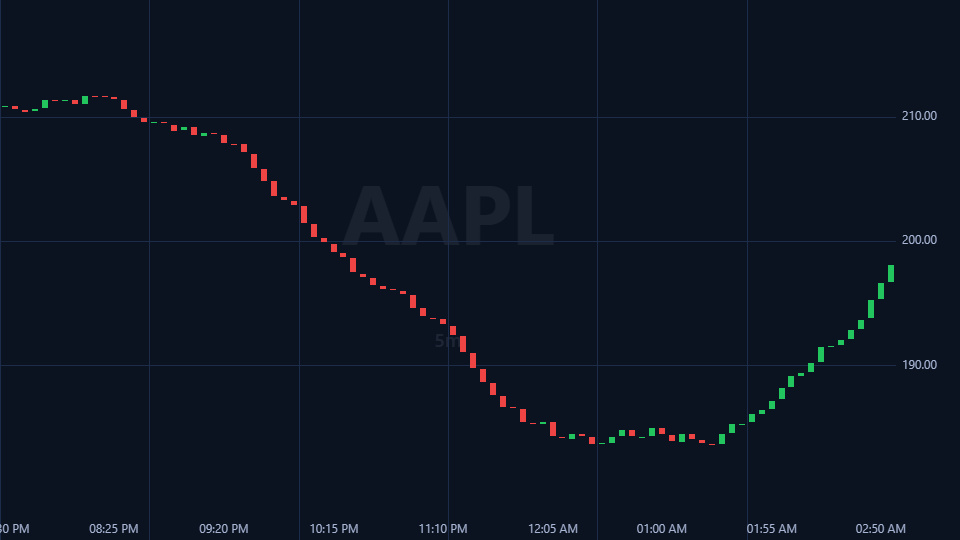
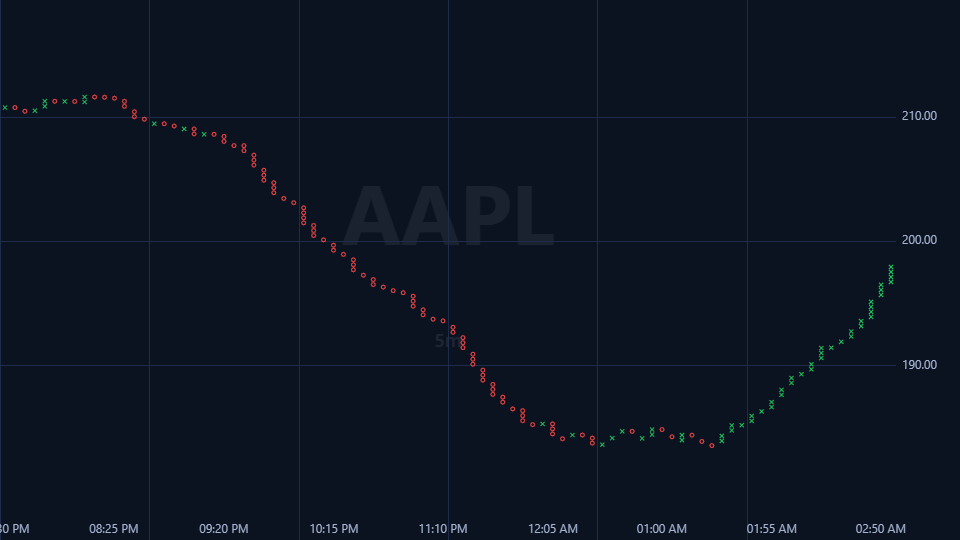
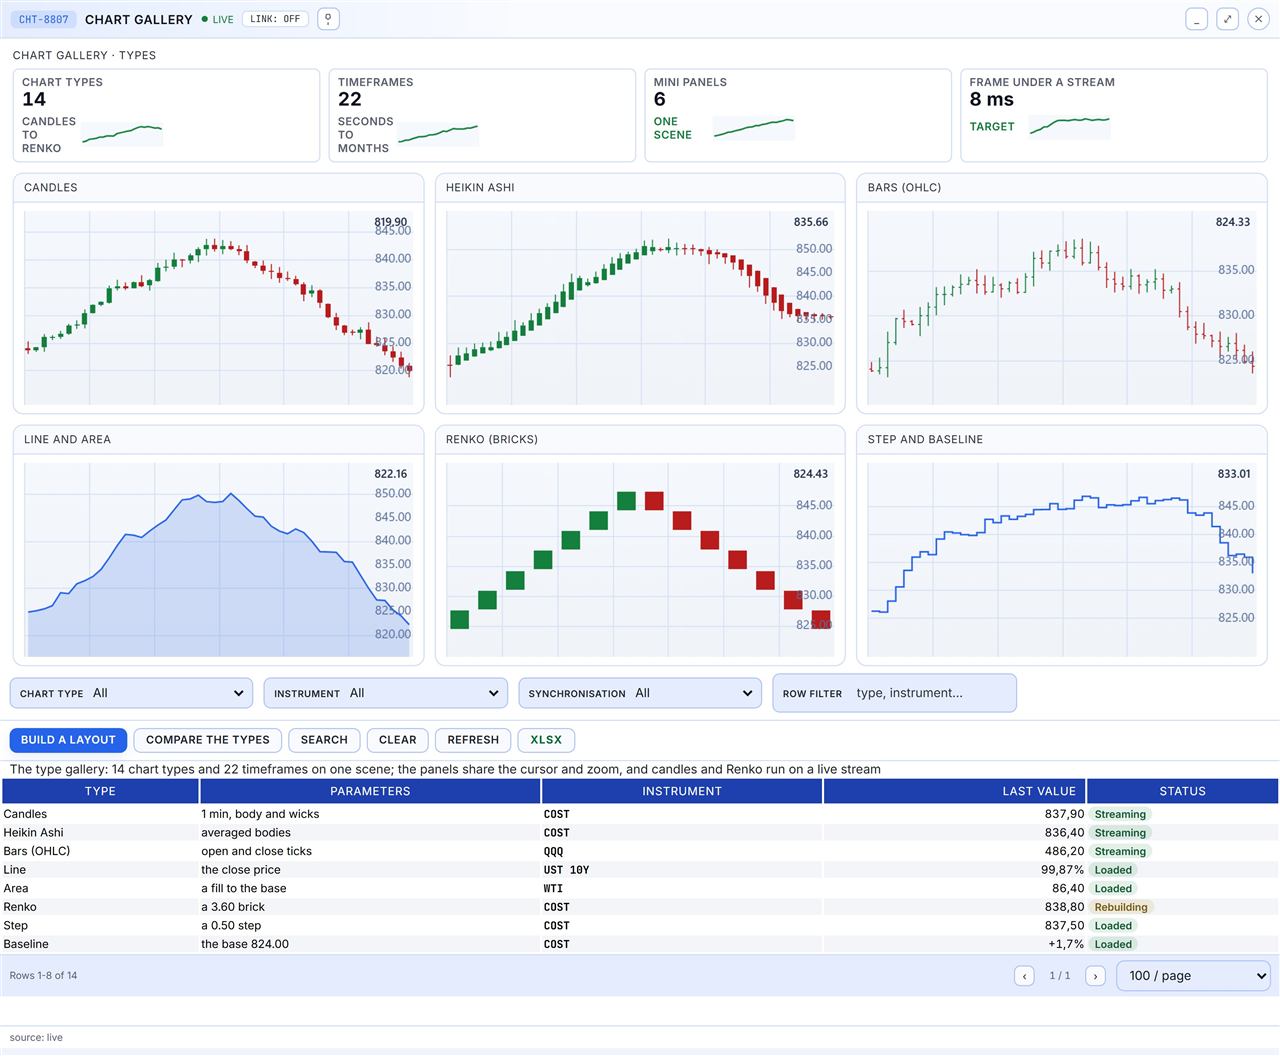
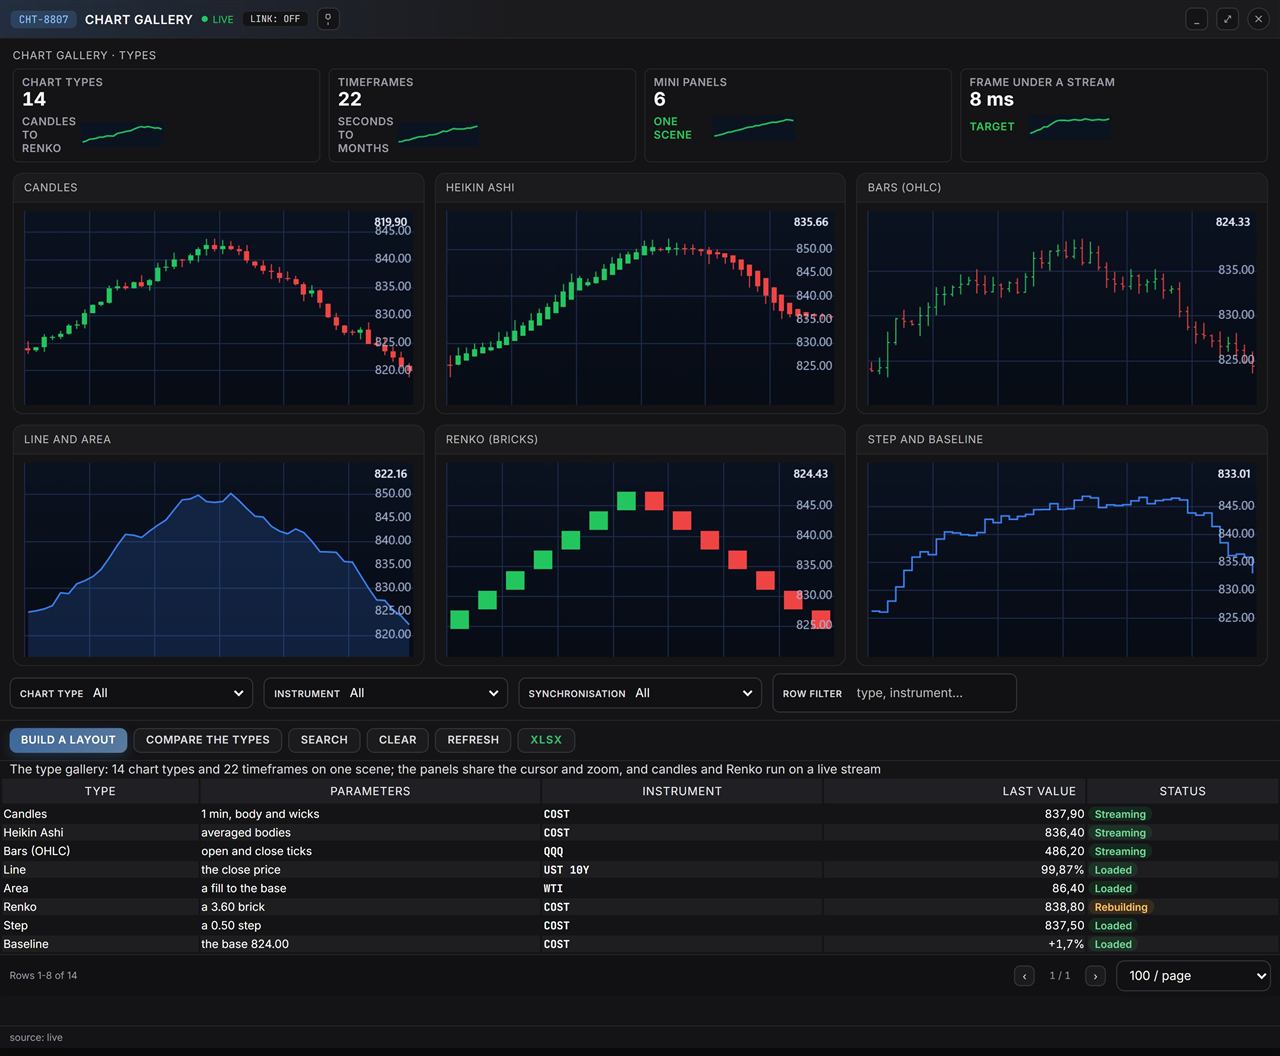
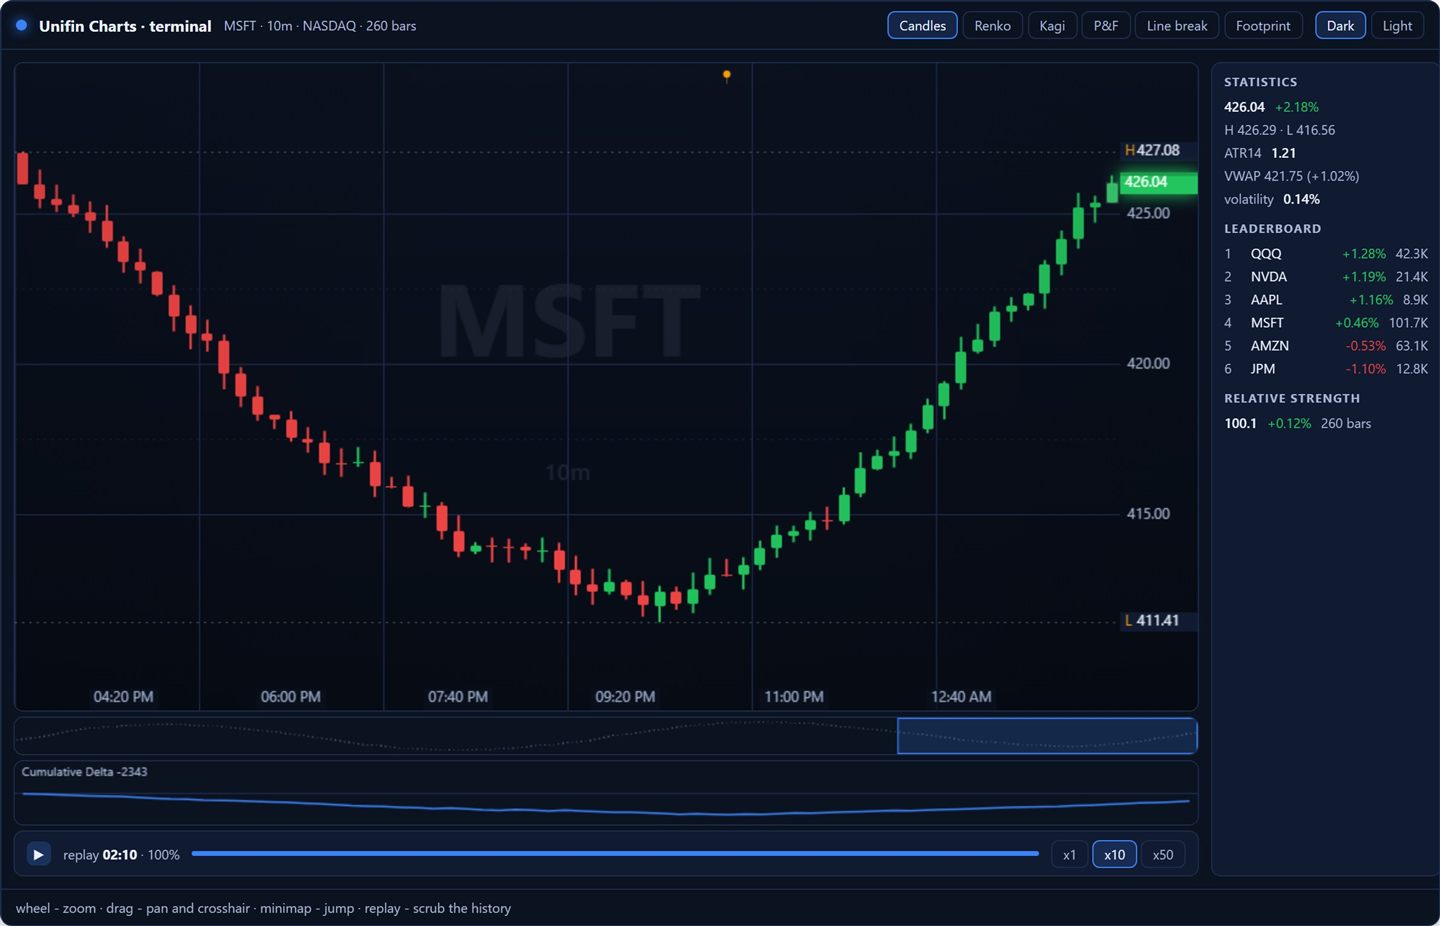
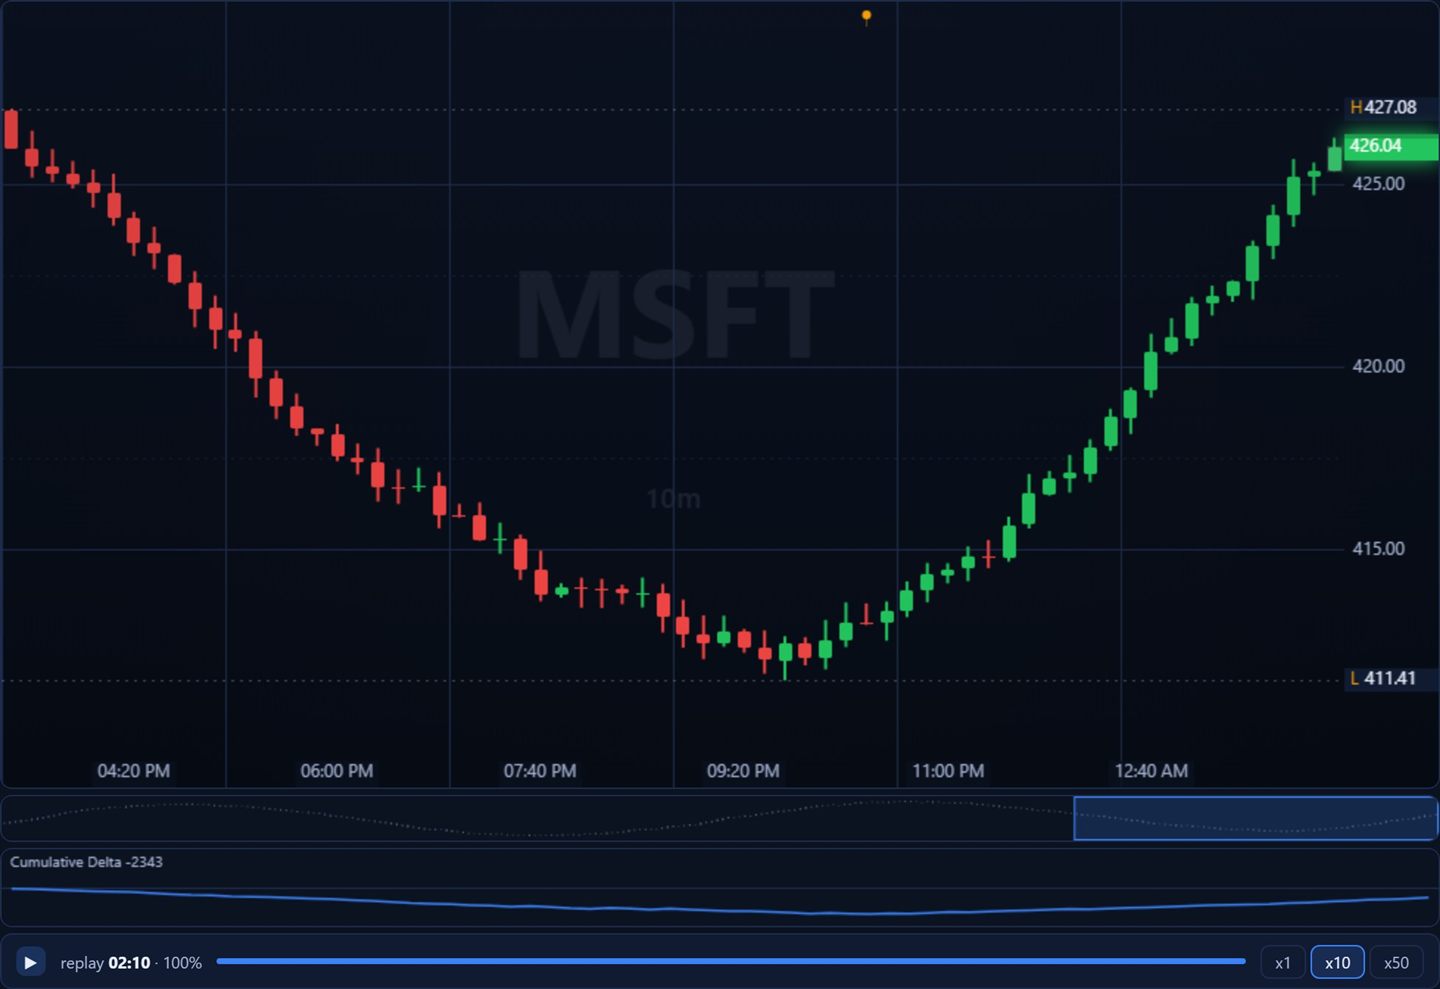
| Chart types | 13 draw types: candles, bars, line, area, baseline, histogram, step, Renko, Kagi, point and figure, Range, Line Break, Heikin Ashi |
| Timeframes | 22 from minutes to months |
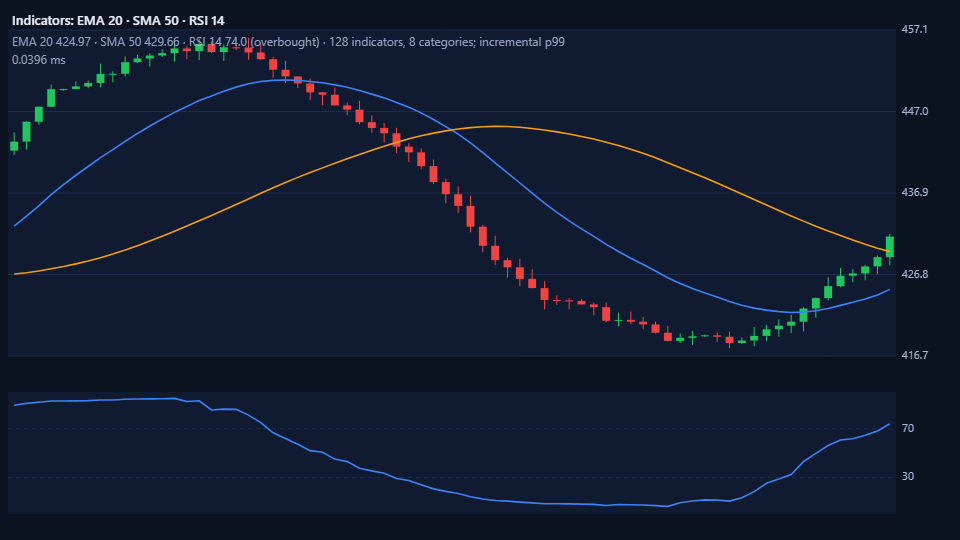
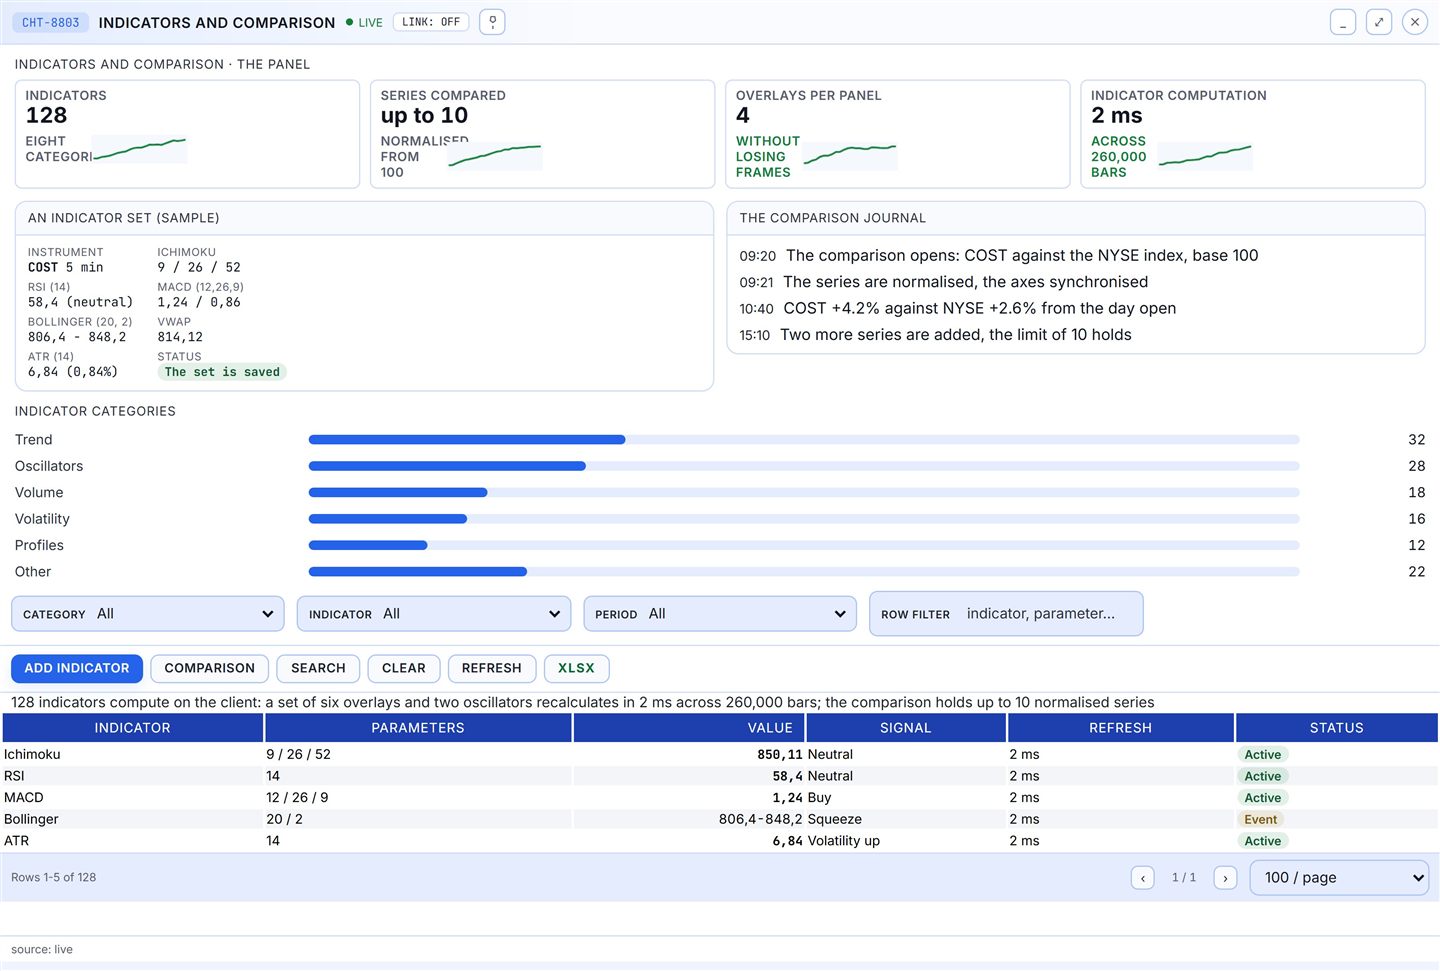
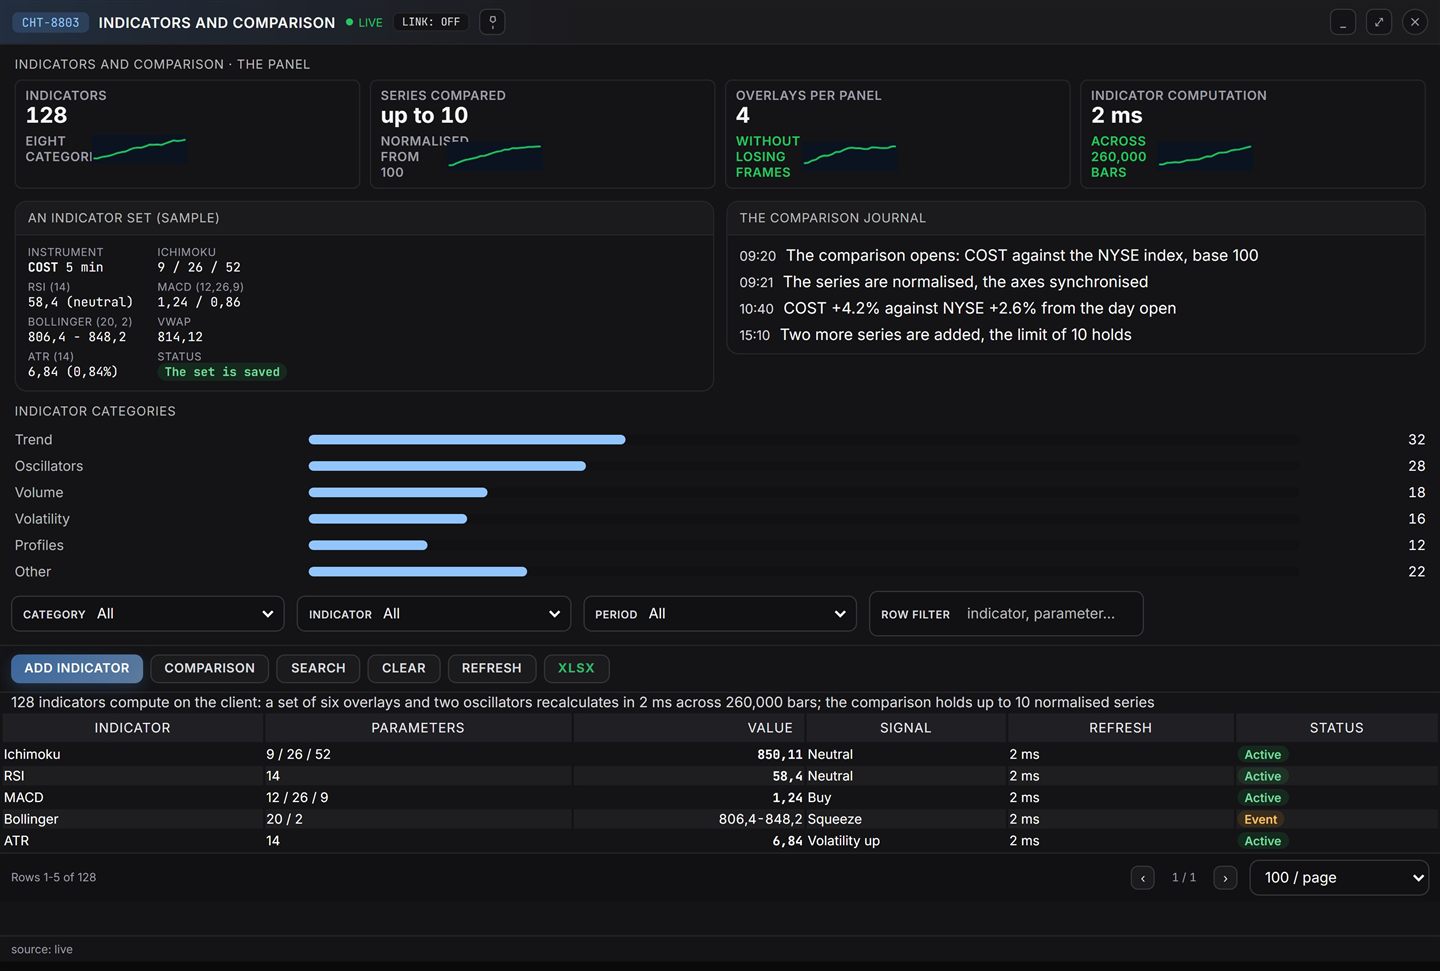
| Indicators | 128 in 8 groups: overlays and oscillators |
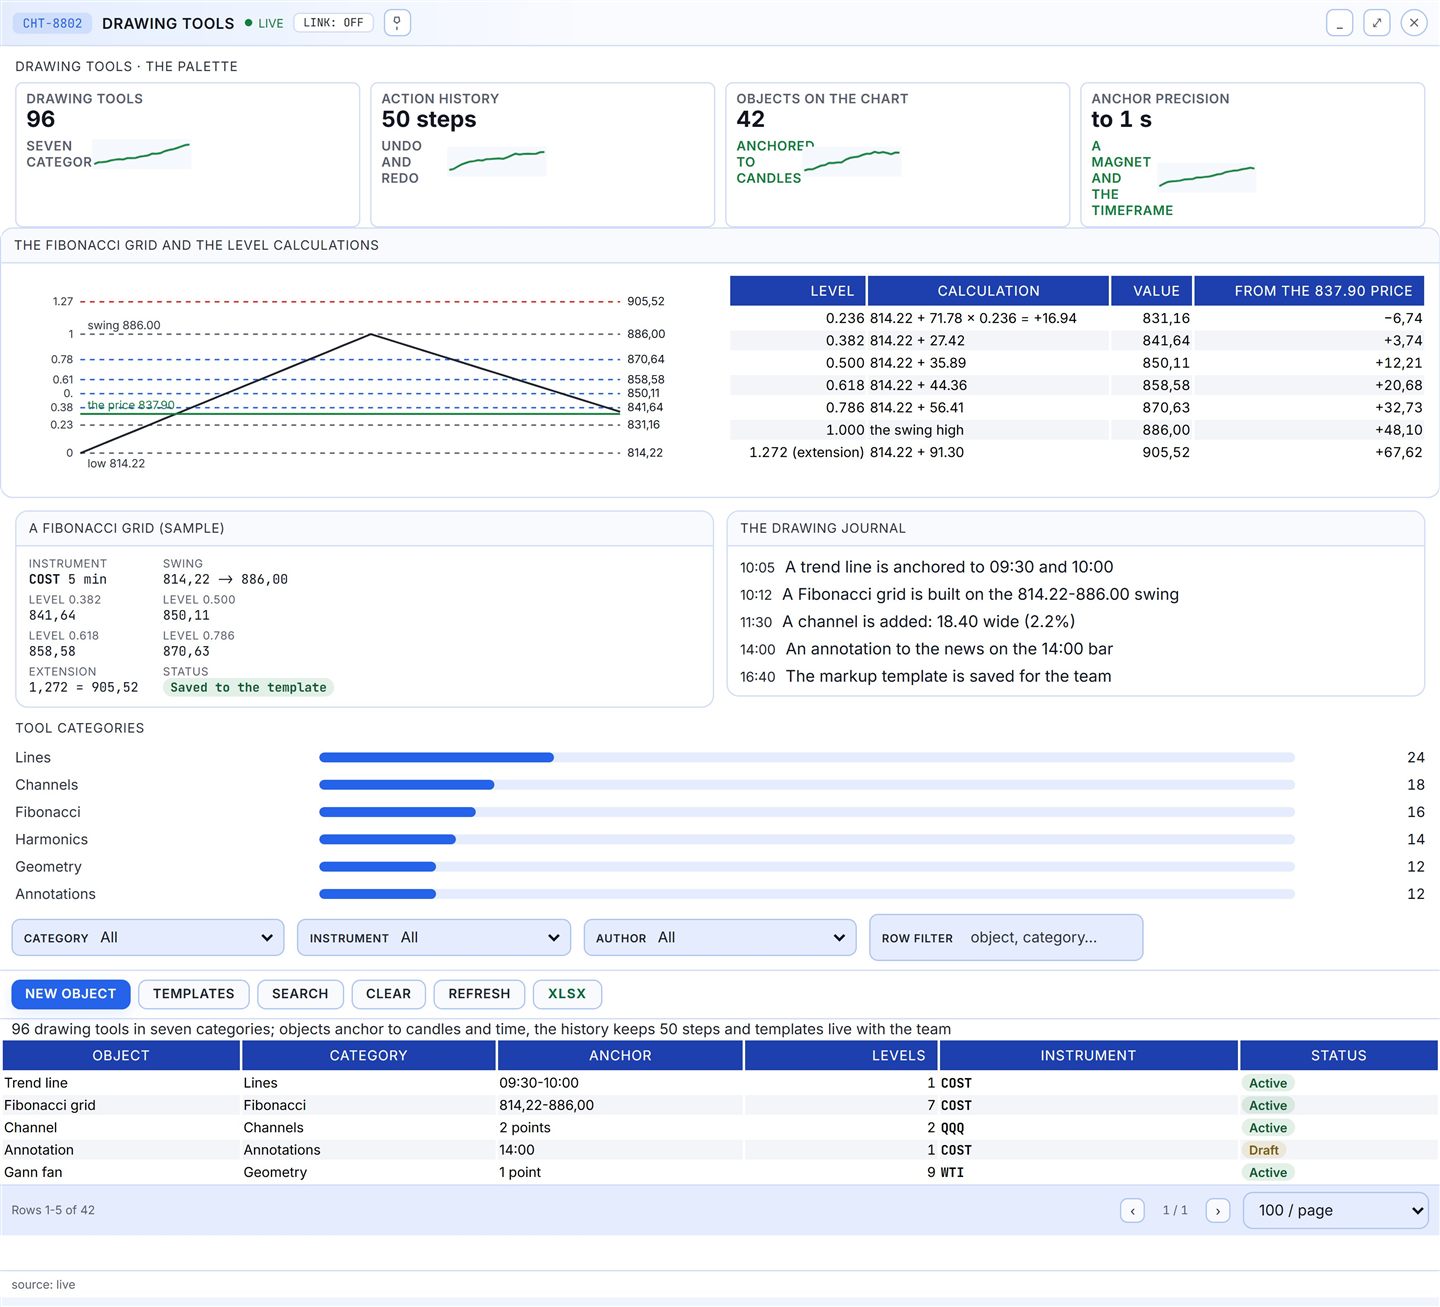
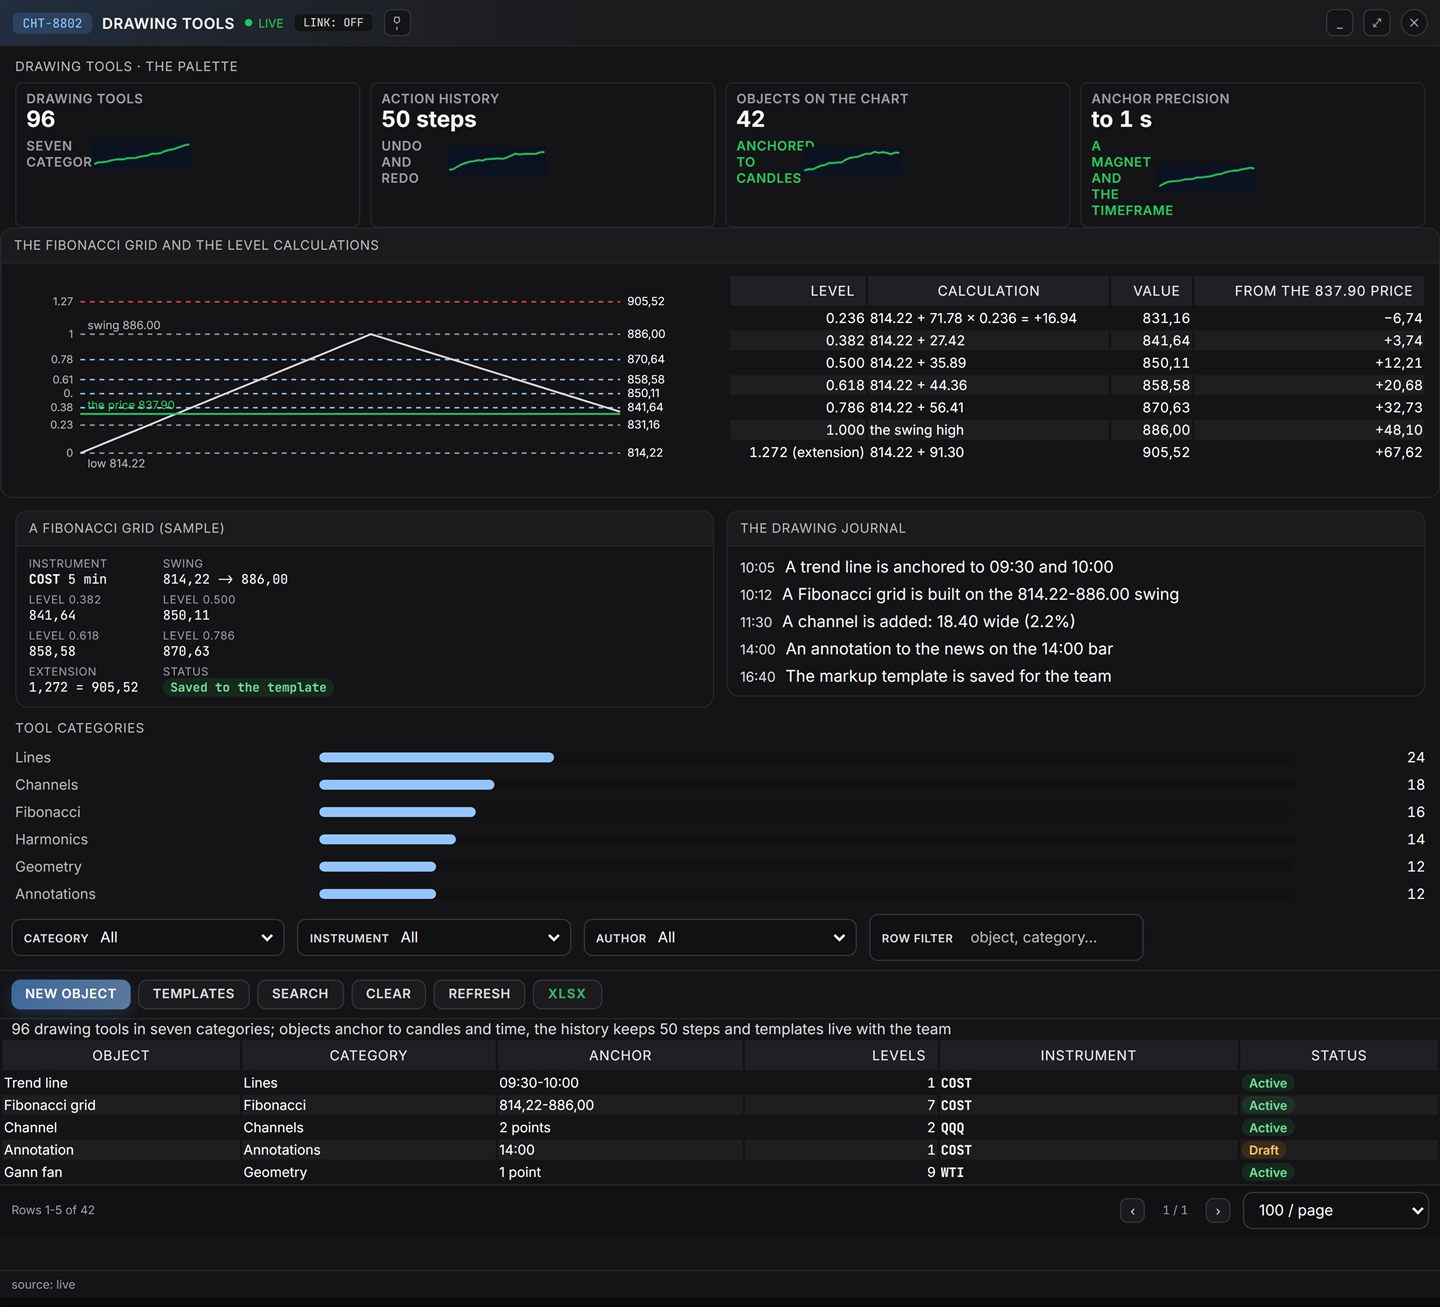
| Drawing tools | 95 in 7 categories with history and templates |
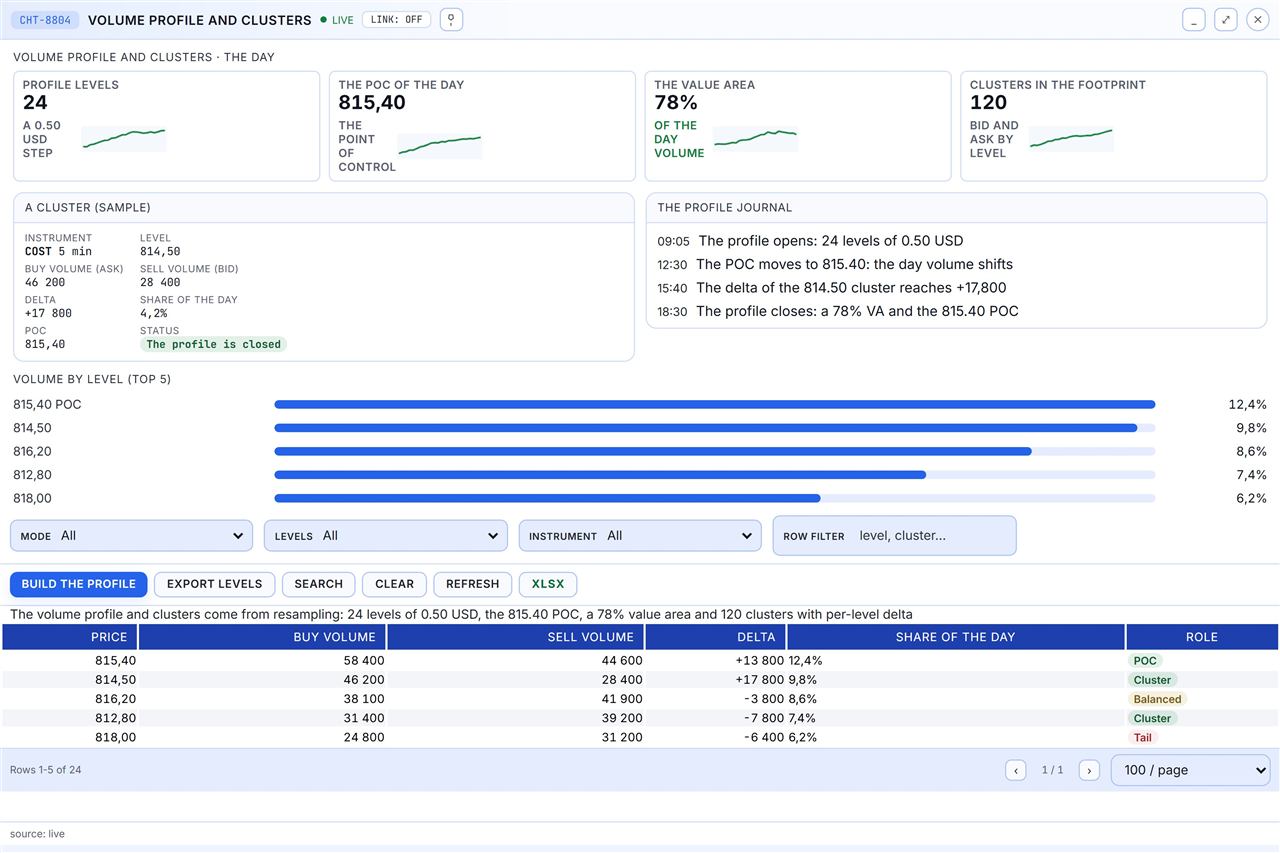
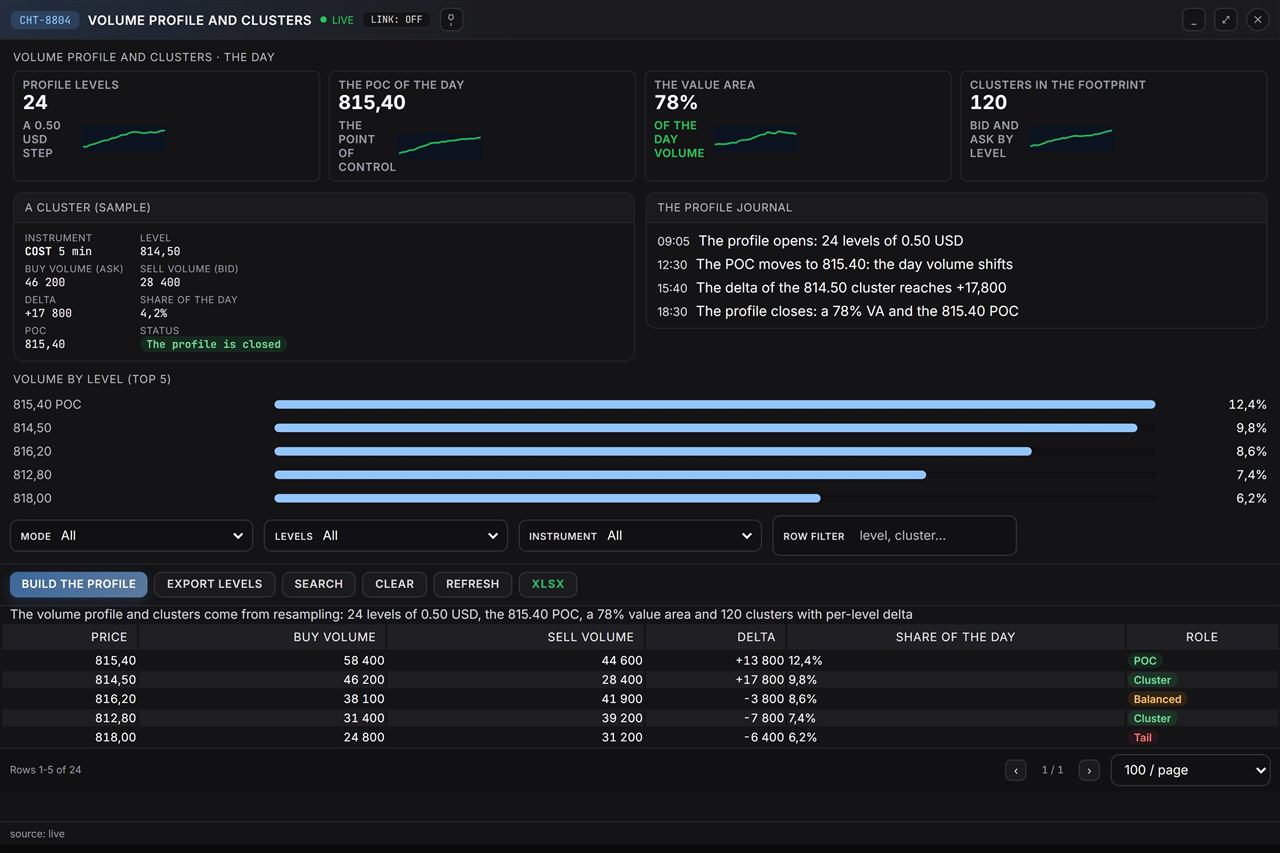
| Volume profile | POC, value area, clusters and TPO letters |
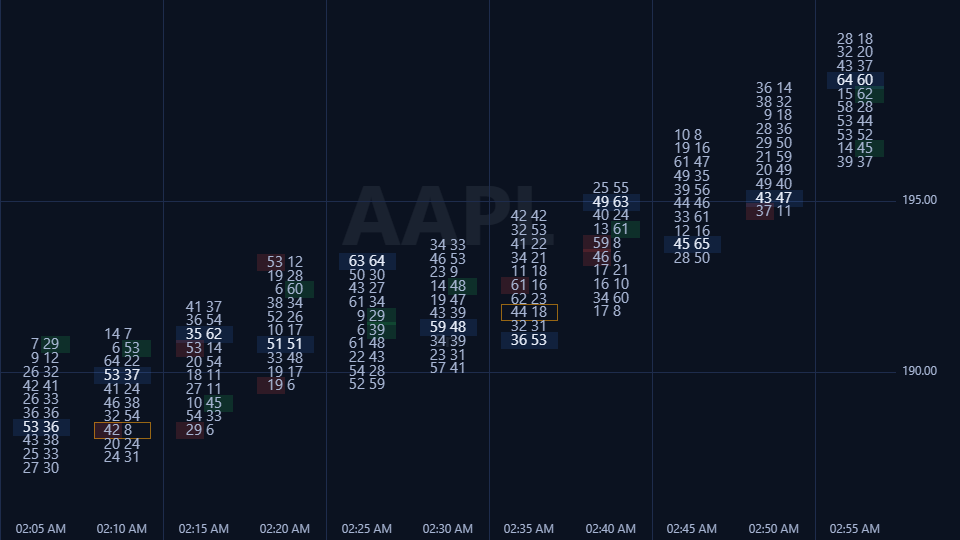
| Order flow | DOM ladder, time and sales, cumulative delta, footprint, volume bubbles |
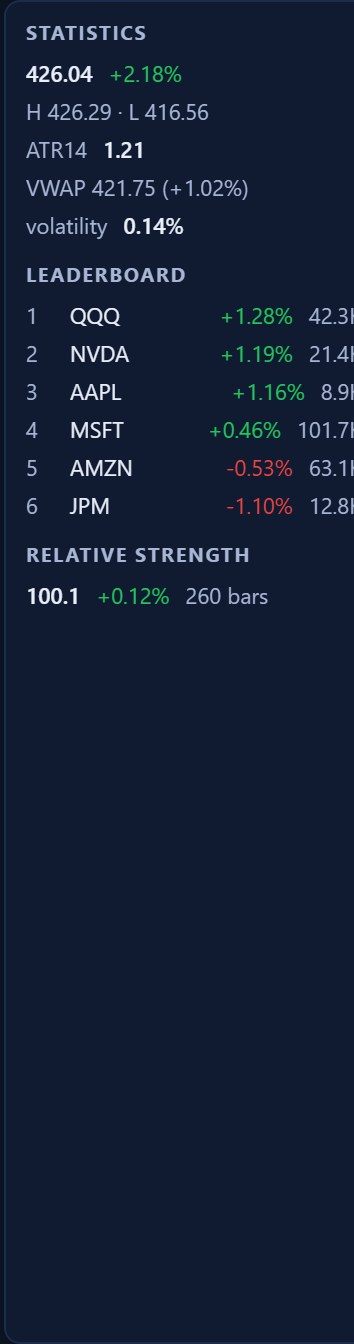
| Comparison | Up to 10 series, leaderboard and relative strength |
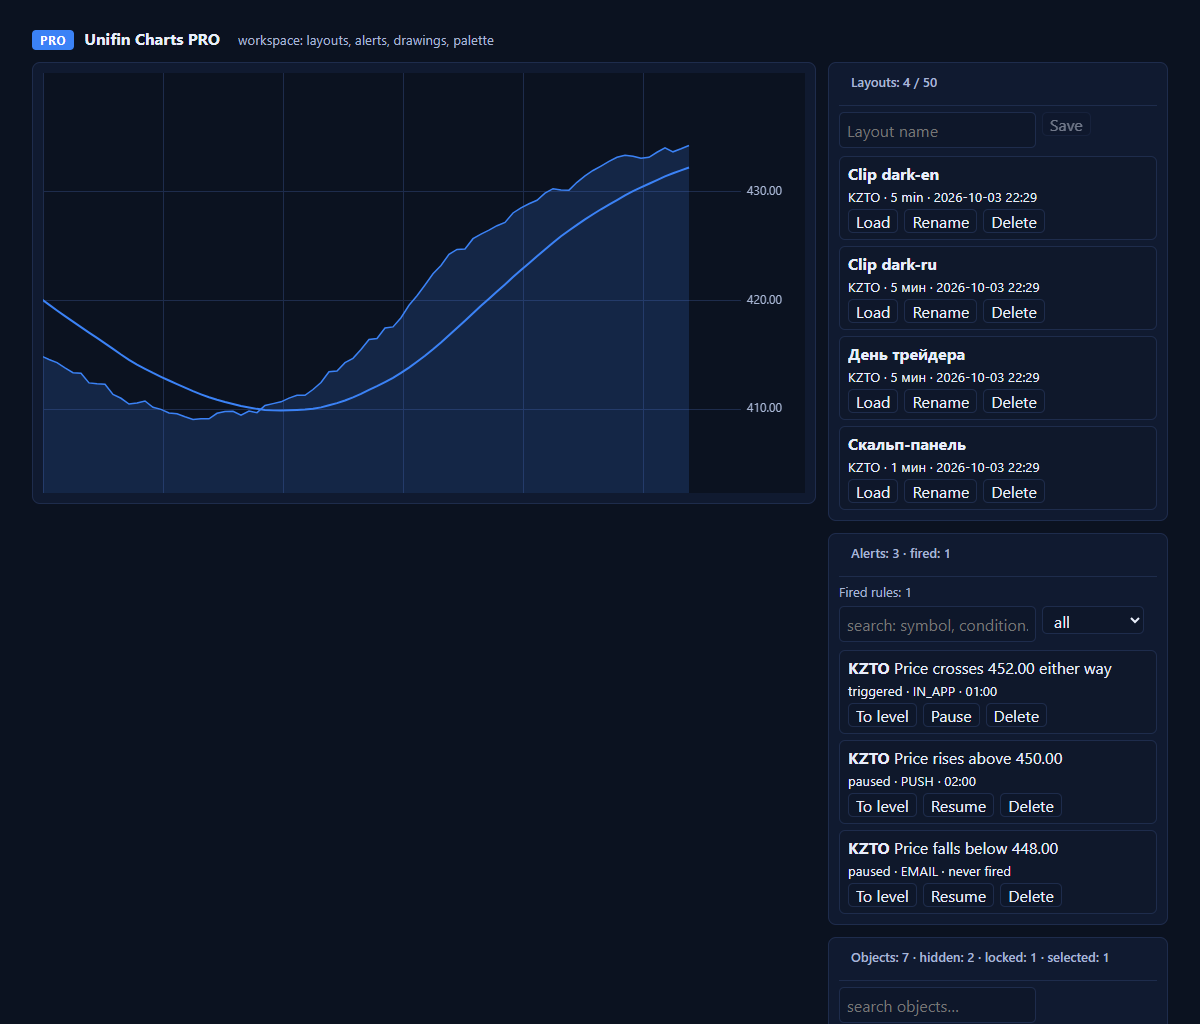
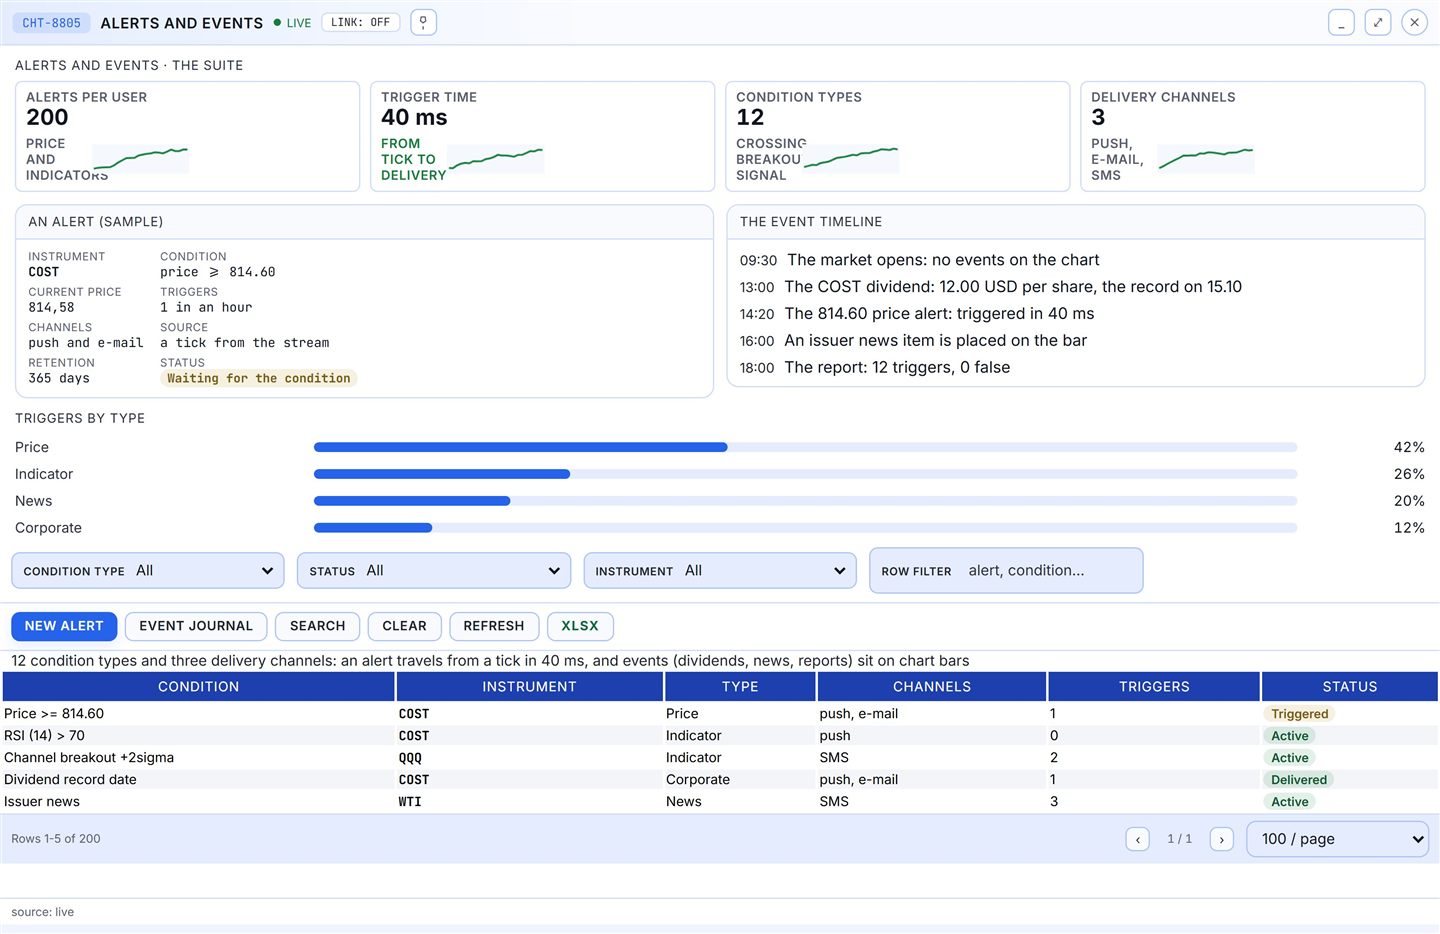
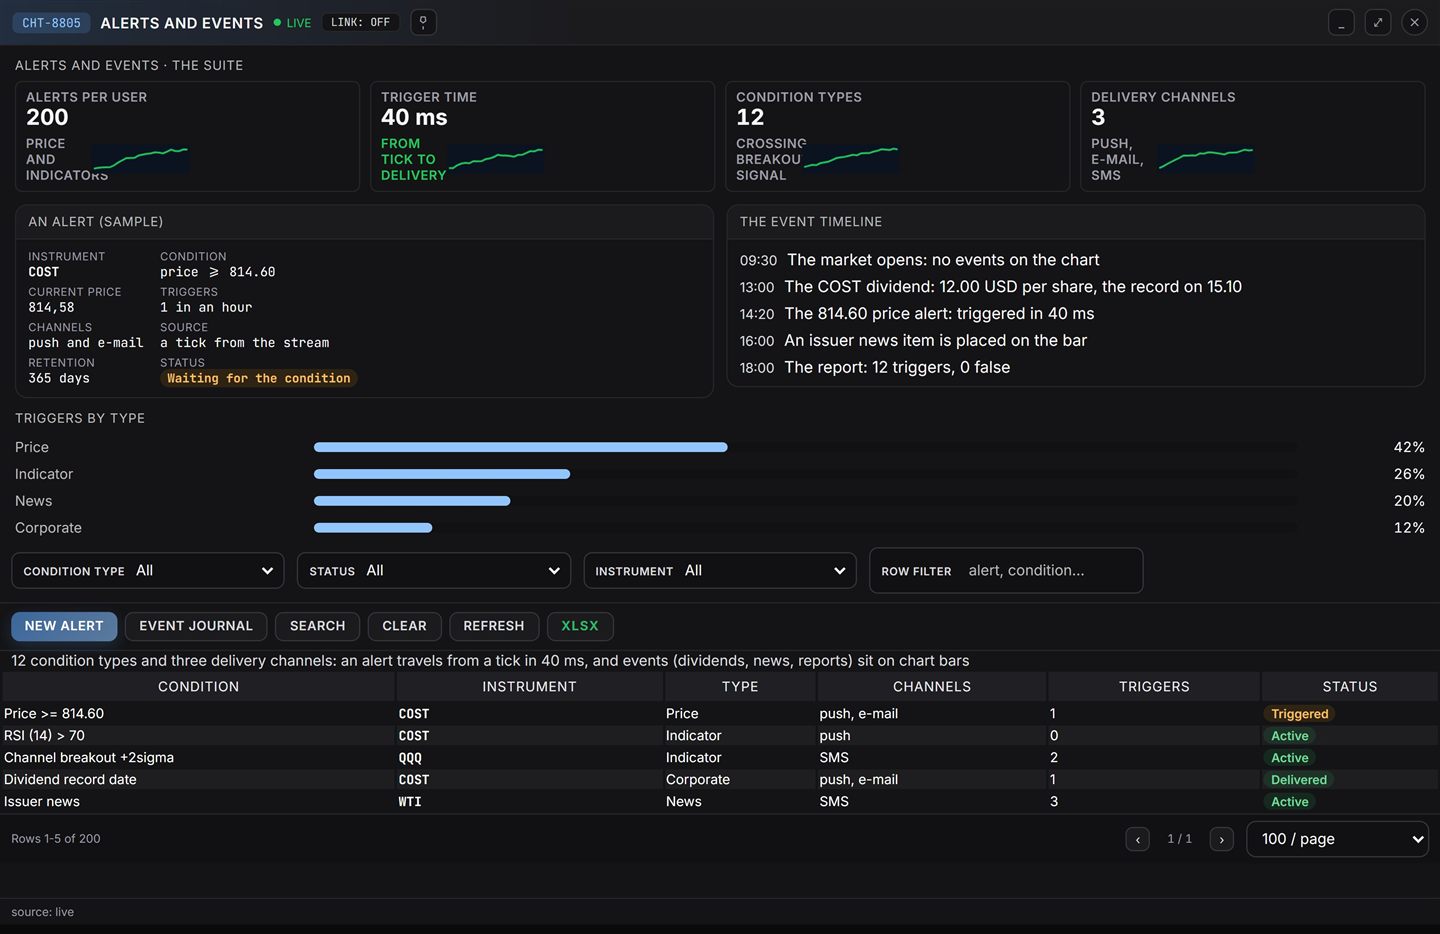
| Alerts | 12 condition types, chains, delivery by e-mail, SMS and push |
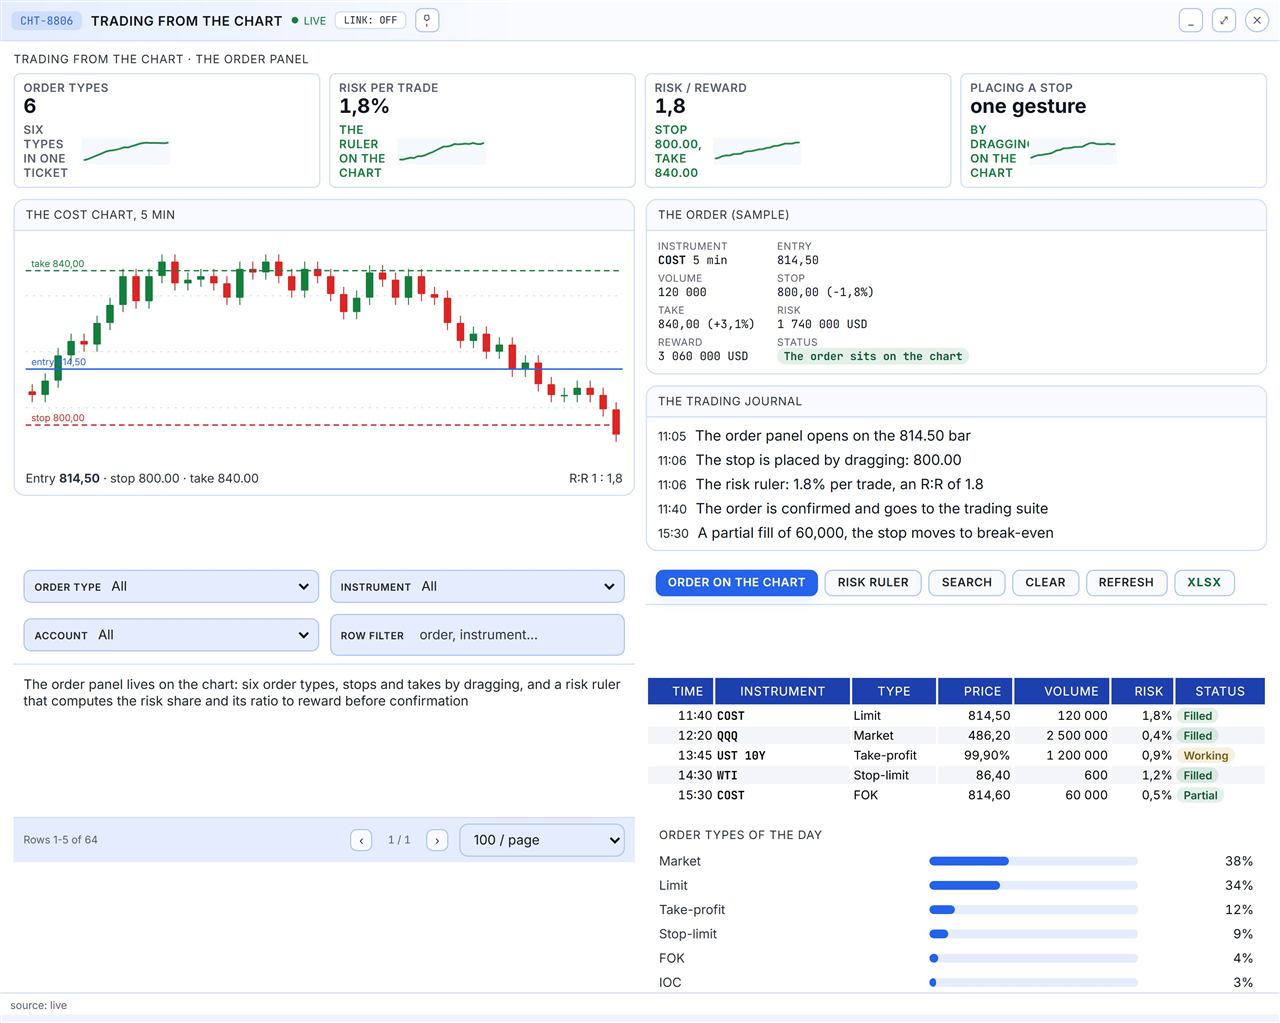
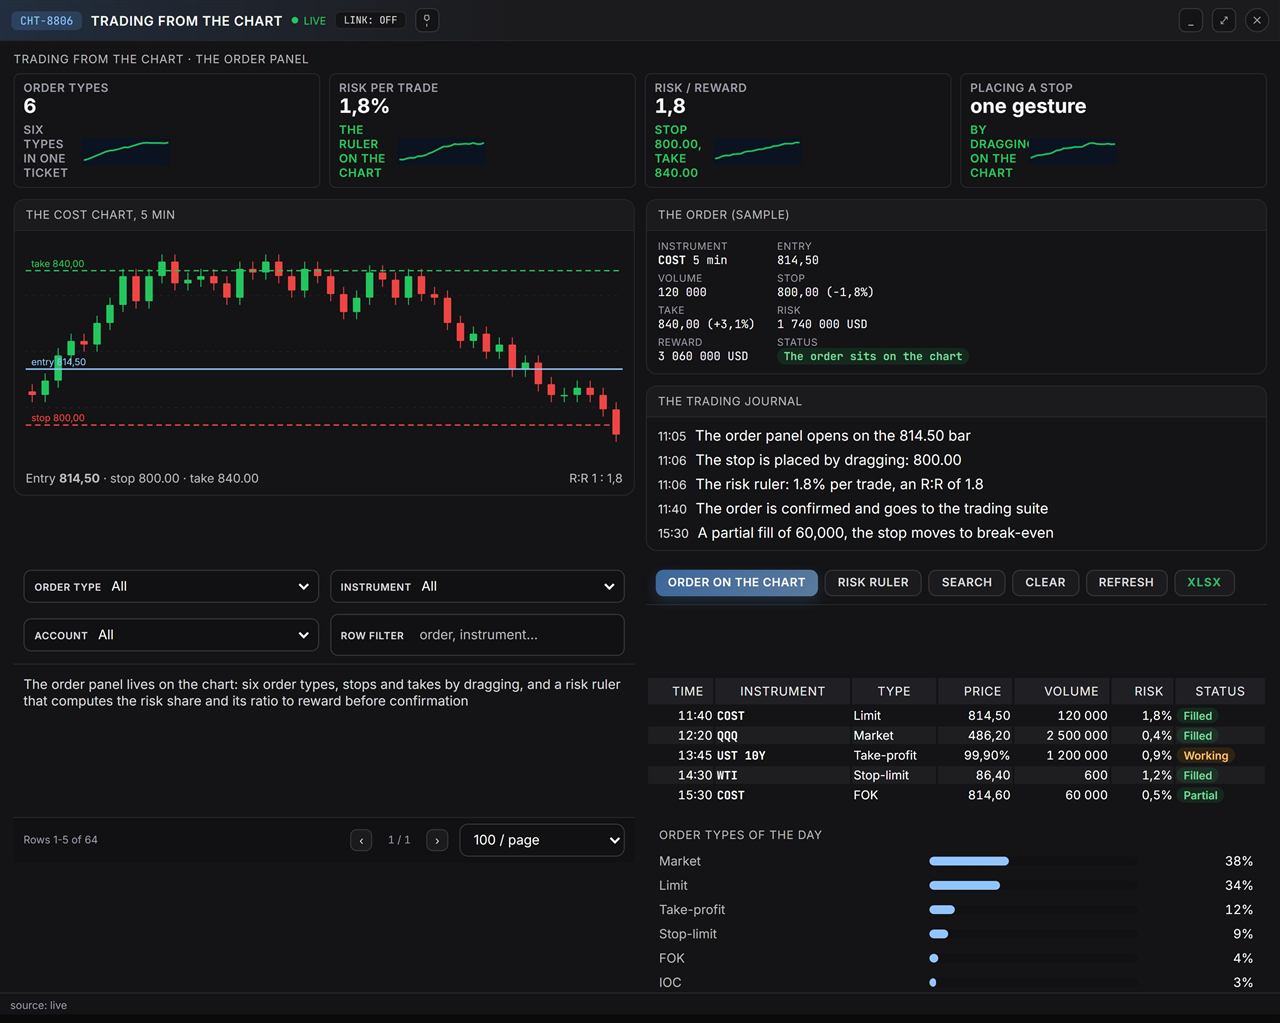
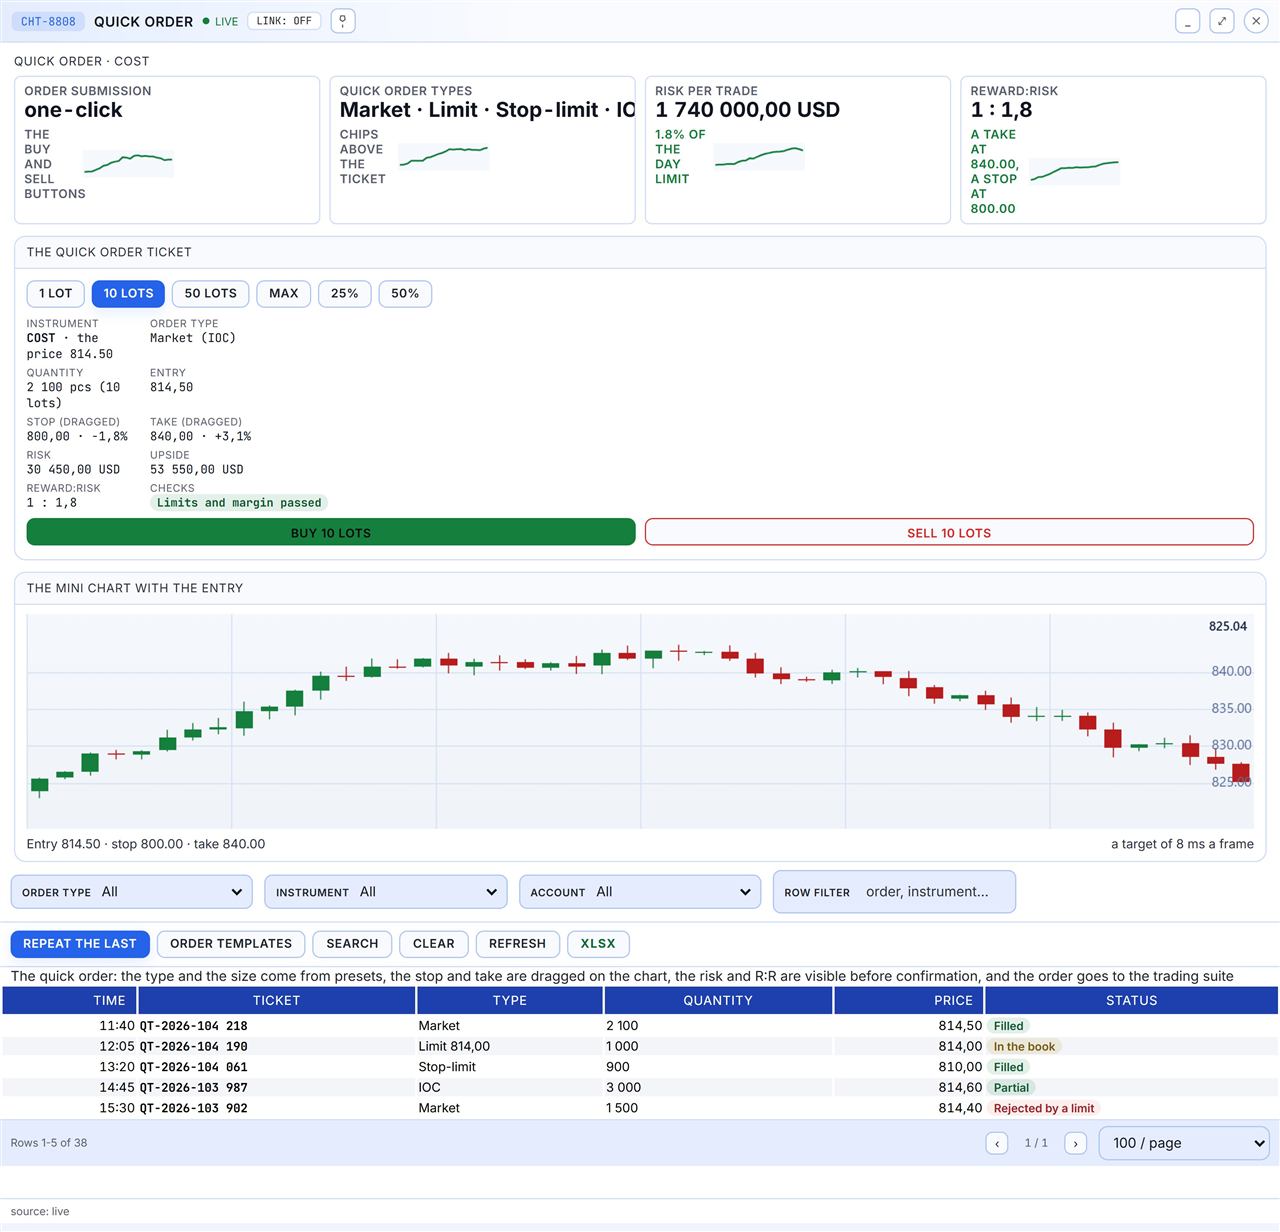
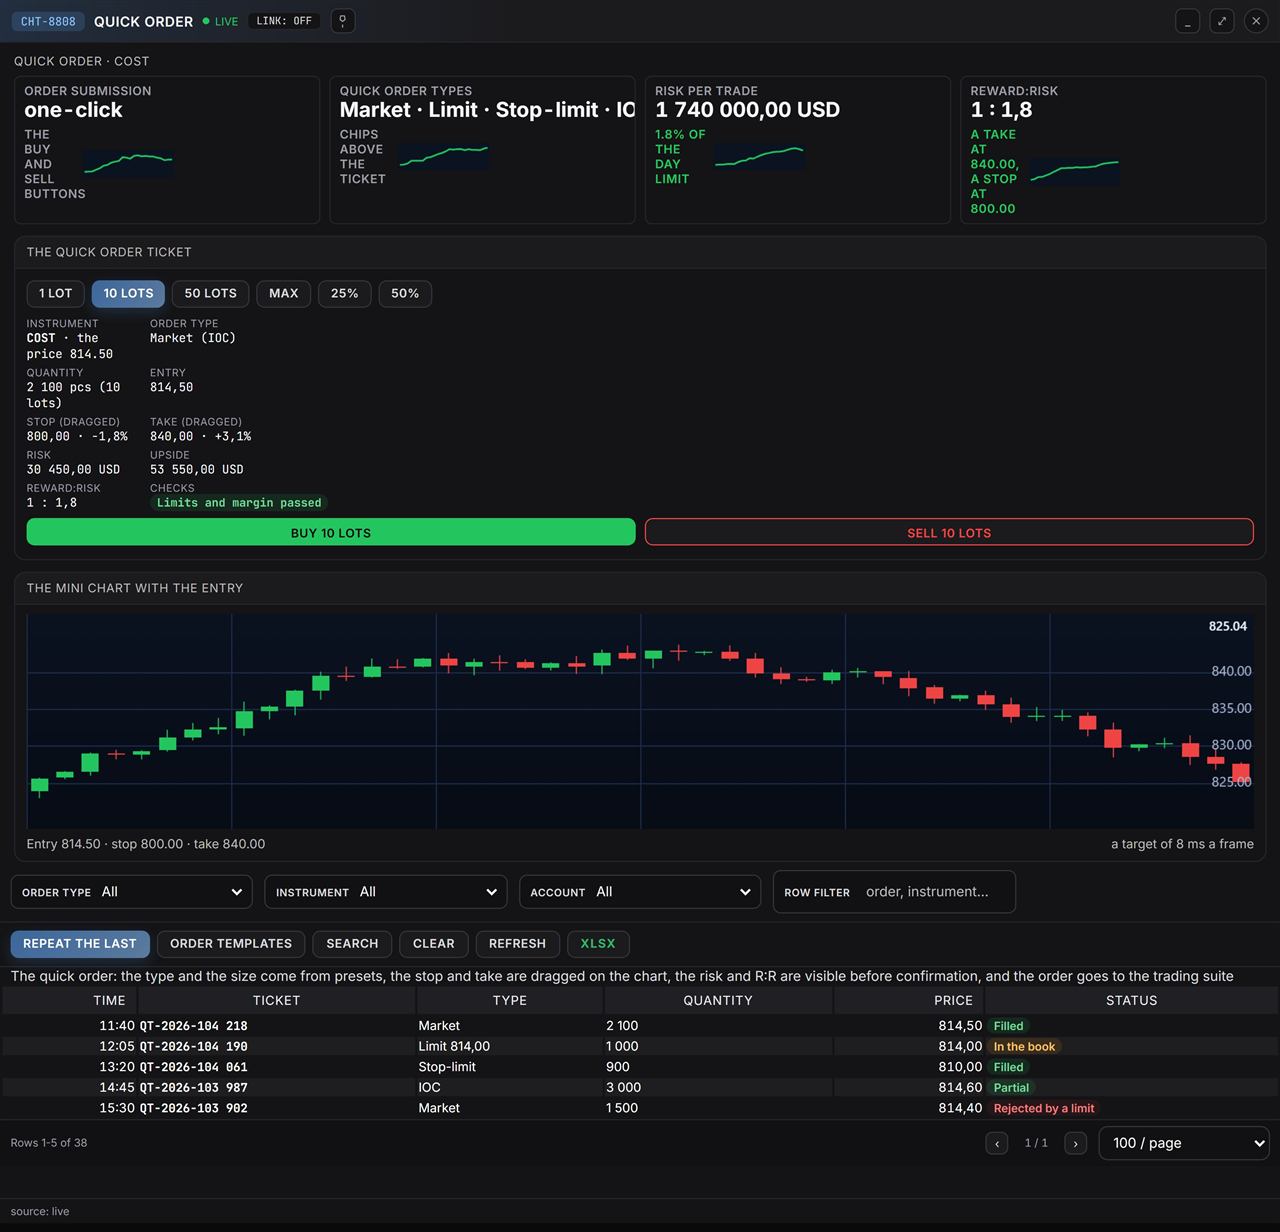
| Trading from the chart | Limit, market, stop-limit, take-profit, FOK and IOC; drag-stop |
| Replay and paper | Bar and market replay, paper trading, session journal |
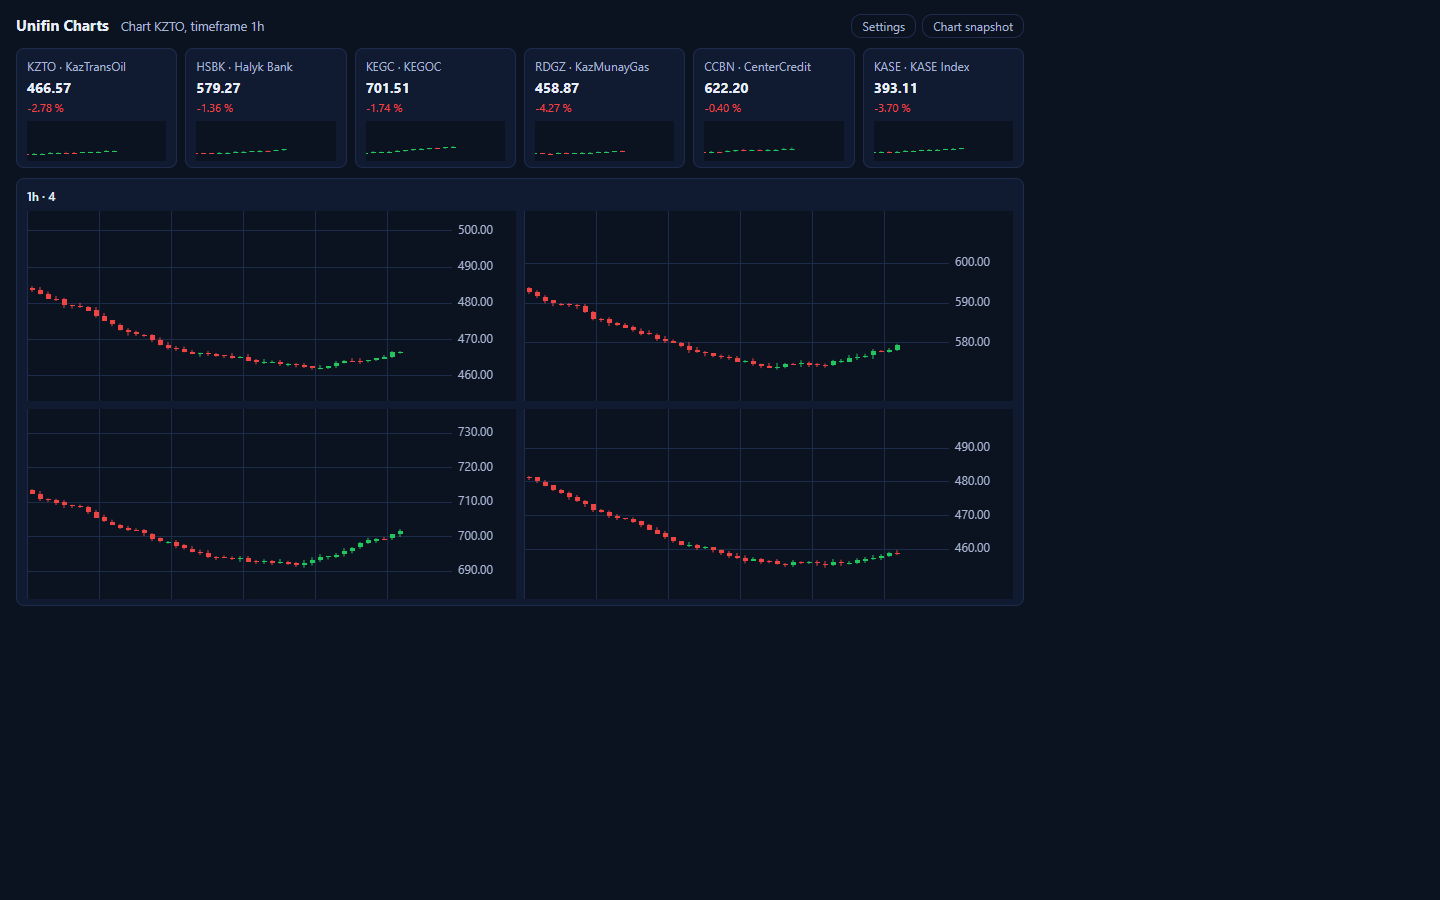
| Multi-chart | Up to 16 panels, LINK crosshair group, popout and share link |
| Scales | Logarithmic, percentage and index price scales |
| Workspace | Saved layouts, object tree, command palette, focus mode and mini-map |
| Export | PNG snapshot, CSV of bars and trades, PDF day report |
| SDK | 180 methods, 62 target events; React, custom element and vanilla |
| Themes and locales | Dark and light themes; RU and EN |
| Accessibility | Keyboard-first, screen reader, 200% text scale |
| Performance | Streams 50 000 ticks per second; 10 million bars with tiles and decimation |
| Provenance | Own code with permissive dependencies only, no foreign attribution |